Share the statistic on social media channels or embed the statistic in your website using "Embed Code", where available.
Share chart
Embed chart Embed copied!Cite this statistic and select one of the following formats: APA, Chicago, Harvard, MLA & Bluebook
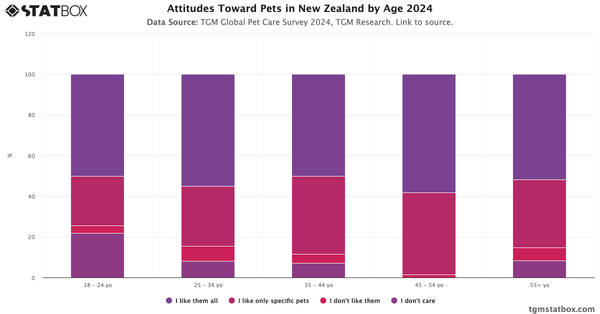
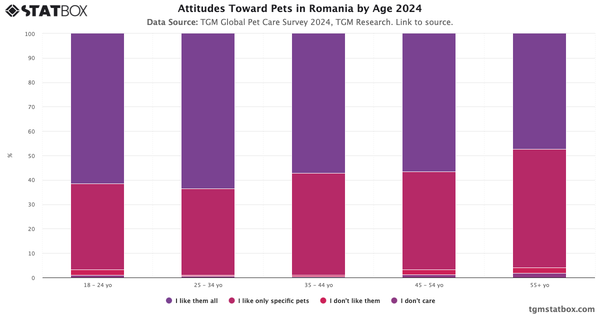
The survey question was, What is your attitude towards pets?
Key Takeaways
Around 60-67% of respondents across all age groups between 18-54 years old prefer specific pets rather than all animals, while roughly 20-27% express affection for all pets. Interestingly, there's minimal gender disparity in these preferences, with both males and females showing nearly identical rates (62%) for liking specific pets, though men demonstrate a slightly higher tendency to like all pets compared to women.
For additional information, visit statistics on Kenyan attitudes toward pets by age, most popular pets in Kenya, most popular pet food brands in Kenya.

Pet Care Report in Kenya 2023
Discover all you need to know about Pet Care in Kenya with TGM StatBox. Get the comprehensive report, featuring graphs and tables for insights.
Go to report


Connect with our expert team for immediate assistance or comprehensive market analysis. We are always ready to support your business needs.