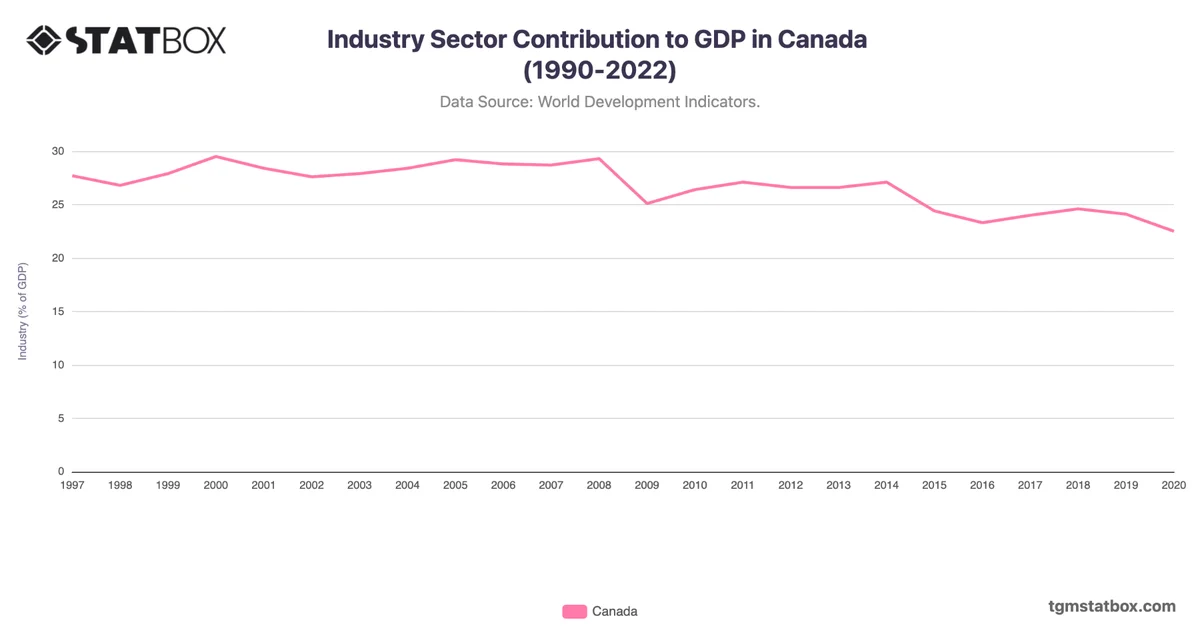
In Canada, the agriculture sector’s contribution to GDP remained steady from 1997 to 2004, fluctuating between 2.1% and 2.2%. This stability reflects the sector's foundational role in Canada's economy despite increasing industrial and service sectors. However, starting in 2005, agriculture's share began a gradual decline, reaching 1.5% in 2009 and remaining close to this level through the following decade. This trend is linked to Canada's shift toward higher-value industries like technology, finance, and energy.
The slight rebound to 1.8% in 2020 may be attributed to increased demand for food security during the COVID-19 pandemic, which highlighted the essential role of agriculture in sustaining the economy during global supply chain disruptions. The sector’s current stability around 1.7-1.8% demonstrates a steady agricultural contribution amidst a diversified economic structure.
The slight rebound to 1.8% in 2020 may be attributed to increased demand for food security during the COVID-19 pandemic, which highlighted the essential role of agriculture in sustaining the economy during global supply chain disruptions. The sector’s current stability around 1.7-1.8% demonstrates a steady agricultural contribution amidst a diversified economic structure.
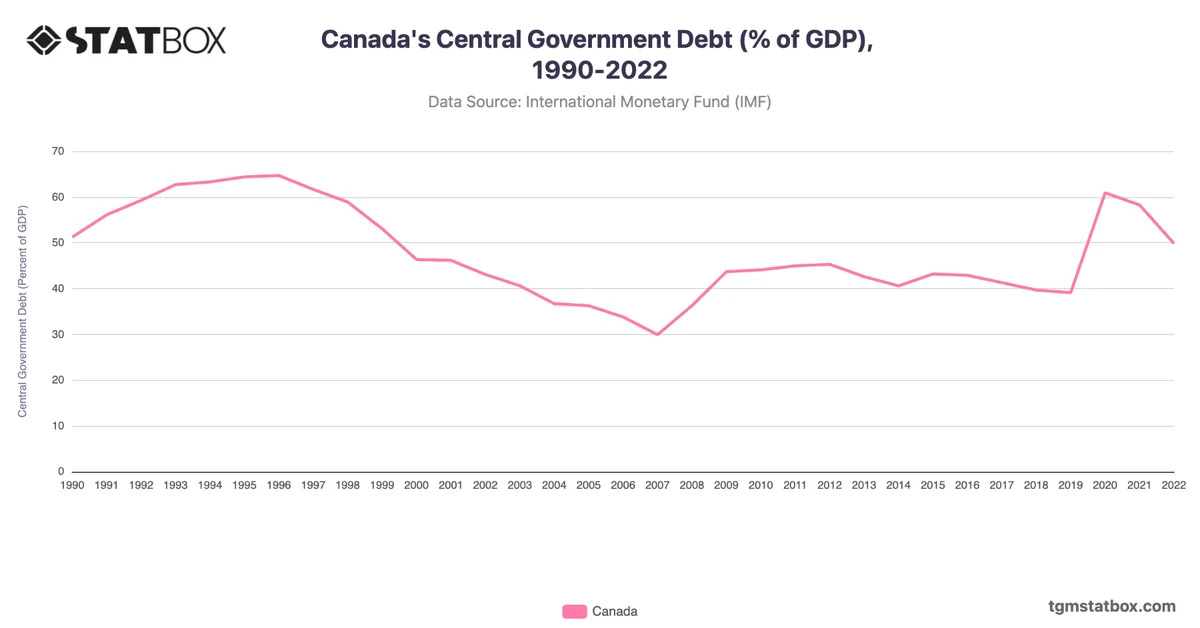
Gain a broader perspective by reviewing Canada’s military share of population, Canada’s yearly GDP figures, Canada’s public debt as a share of GDP.