Canada’s central government debt (% of GDP) followed a two-phased trajectory between 1990 and 2022. Debt levels climbed from 51.22% in 1990 to a high of 64.69% in 1996, primarily due to economic recession and high deficits during the early 1990s. Fiscal reforms in the late 1990s, coupled with a robust economy, led to a consistent decline, reaching 29.9% by 2007.
However, the global financial crisis in 2008 triggered a reversal, with debt rising to 43.67% in 2009 as the government implemented stimulus measures. The sharp spike in 2020, to 60.9%, reflects fiscal responses to the pandemic, including income support programs and healthcare spending. By 2022, debt had declined to 49.83%, demonstrating economic recovery and fiscal consolidation efforts.
However, the global financial crisis in 2008 triggered a reversal, with debt rising to 43.67% in 2009 as the government implemented stimulus measures. The sharp spike in 2020, to 60.9%, reflects fiscal responses to the pandemic, including income support programs and healthcare spending. By 2022, debt had declined to 49.83%, demonstrating economic recovery and fiscal consolidation efforts.
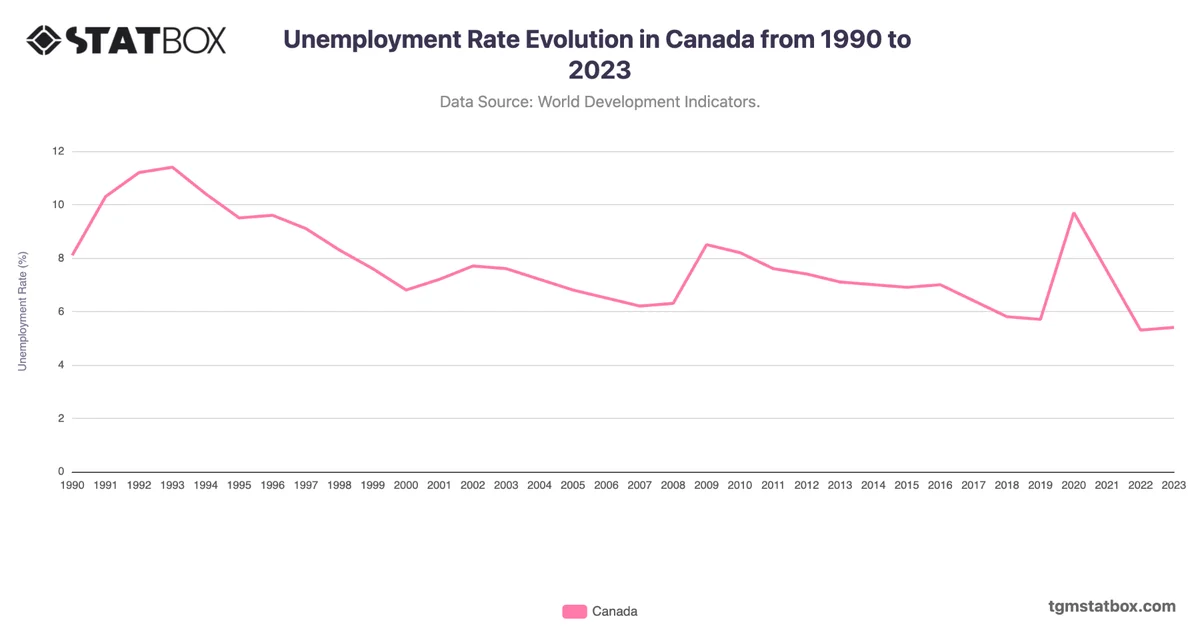
Explore related charts to gain a better understanding of Canada’s unemployment rate trend, Canada’s service sector share in GDP, Canada’s net lending/borrowing as a percentage of GDP.