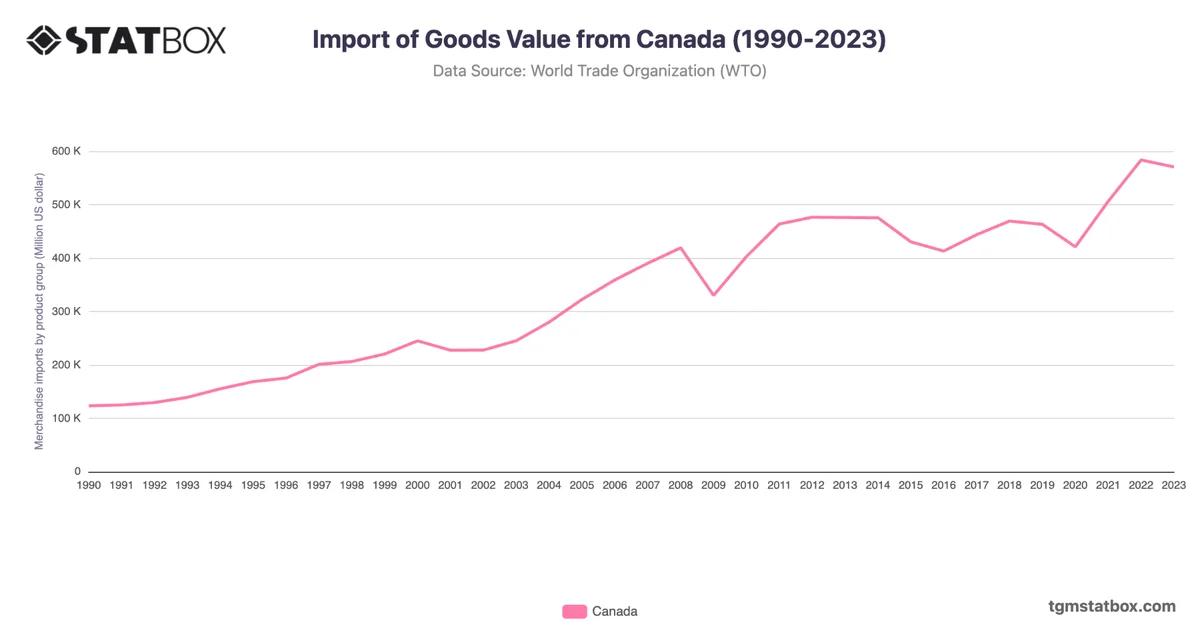
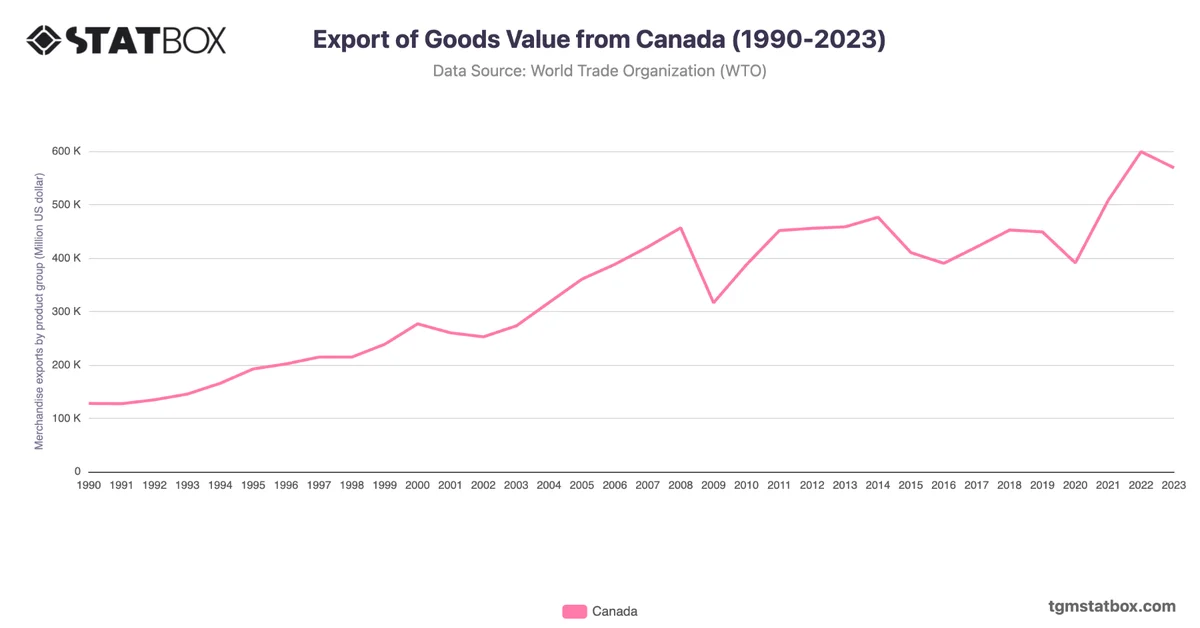
Canada’s trade balance of goods underwent significant fluctuations between 2017 and 2023, transitioning from a persistent deficit to occasional surpluses. The trade deficit narrowed from -22,986.3 million USD in 2017 to -14,176.0 million USD in 2019, supported by strong export performance in energy and automotive sectors. However, the deficit widened sharply in 2020 (-30,113.3 million USD) due to pandemic-driven disruptions in global trade and reduced energy exports.
A turning point occurred in 2021, with Canada recording a surplus of 1,938.8 million USD, followed by a peak surplus of 15,482.7 million USD in 2022, fueled by a rebound in energy exports amid soaring global oil prices. By 2023, the trade balance returned to a slight deficit of -1,161.9 million USD, reflecting moderating export growth and rising imports of manufactured goods. This variability highlights Canada’s economic dependence on energy exports and sensitivity to global market shifts.
A turning point occurred in 2021, with Canada recording a surplus of 1,938.8 million USD, followed by a peak surplus of 15,482.7 million USD in 2022, fueled by a rebound in energy exports amid soaring global oil prices. By 2023, the trade balance returned to a slight deficit of -1,161.9 million USD, reflecting moderating export growth and rising imports of manufactured goods. This variability highlights Canada’s economic dependence on energy exports and sensitivity to global market shifts.
For a broader context, visit other statistics on Canada’s manufacturing contribution to GDP, Canada population growth trends, Canada’s yearly GDP figures.