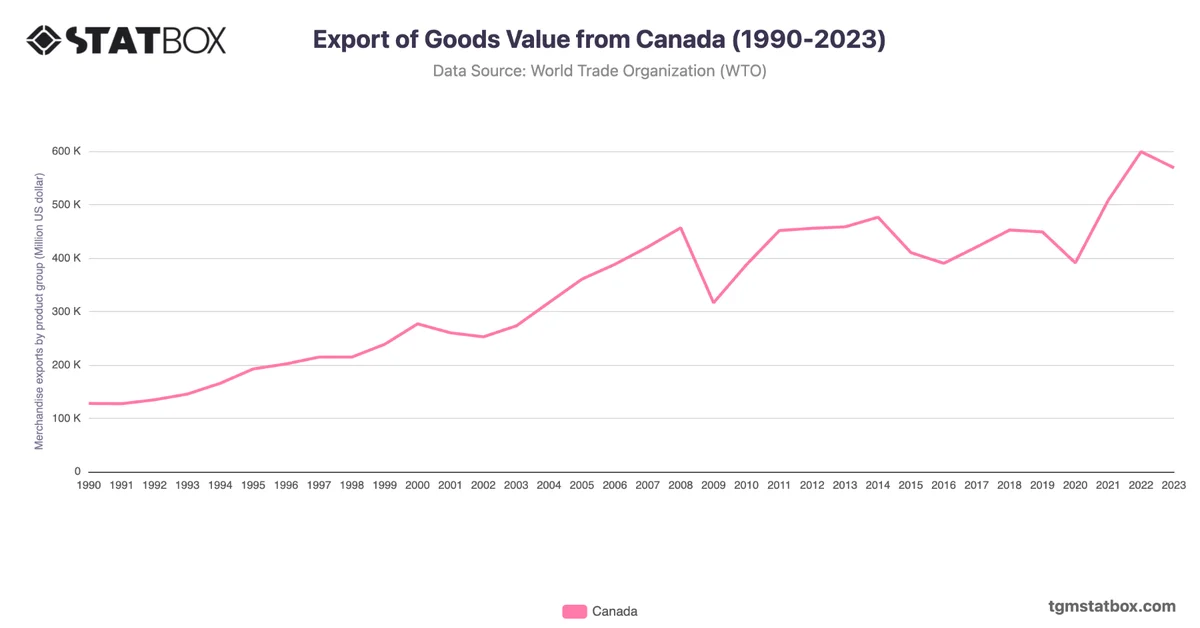
Canada’s import value consistently increased from $123.2B in 1990 to a peak of $583.5B in 2022, reflecting its strong economic growth and integration into global trade networks. Notable growth periods, such as between 1997 and 2007, when imports nearly doubled from $200.9B to $390.1B, were fueled by the North American Free Trade Agreement (NAFTA) and expanding manufacturing and consumer markets.
The 2008 global financial crisis led to a dip in imports to $329.9B in 2009, followed by a recovery phase peaking in 2022, driven by rising energy costs and robust demand for machinery and consumer goods. The slight decline to $570.5B in 2023 reflects global economic adjustments and stabilization. These trends underscore Canada's reliance on imports for industrial development and consumer satisfaction.
The 2008 global financial crisis led to a dip in imports to $329.9B in 2009, followed by a recovery phase peaking in 2022, driven by rising energy costs and robust demand for machinery and consumer goods. The slight decline to $570.5B in 2023 reflects global economic adjustments and stabilization. These trends underscore Canada's reliance on imports for industrial development and consumer satisfaction.
For additional information, visit statistics on Canada’s manufacturing contribution to GDP, Canada’s yearly GDP figures, Canada’s annual GDP growth rate.