Canada GDP Growth Rate (1961–2023)
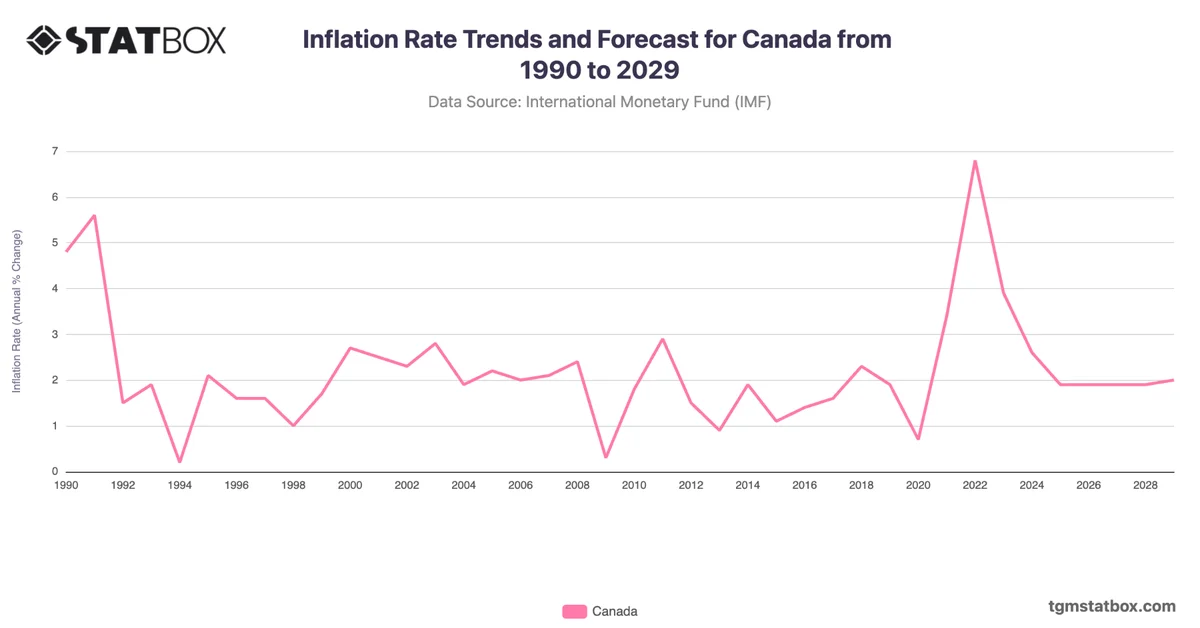
Canada’s GDP growth displayed notable fluctuations influenced by economic policies, global crises, and structural shifts. In the early 1960s, growth was robust, peaking at 7.4% in 1962, largely due to expansive government investment and a booming manufacturing sector. The late 1970s and early 1980s saw a significant downturn, with growth falling to -3.2% in 1982, impacted by the global oil crisis and restrictive monetary policies aimed at curbing inflation.
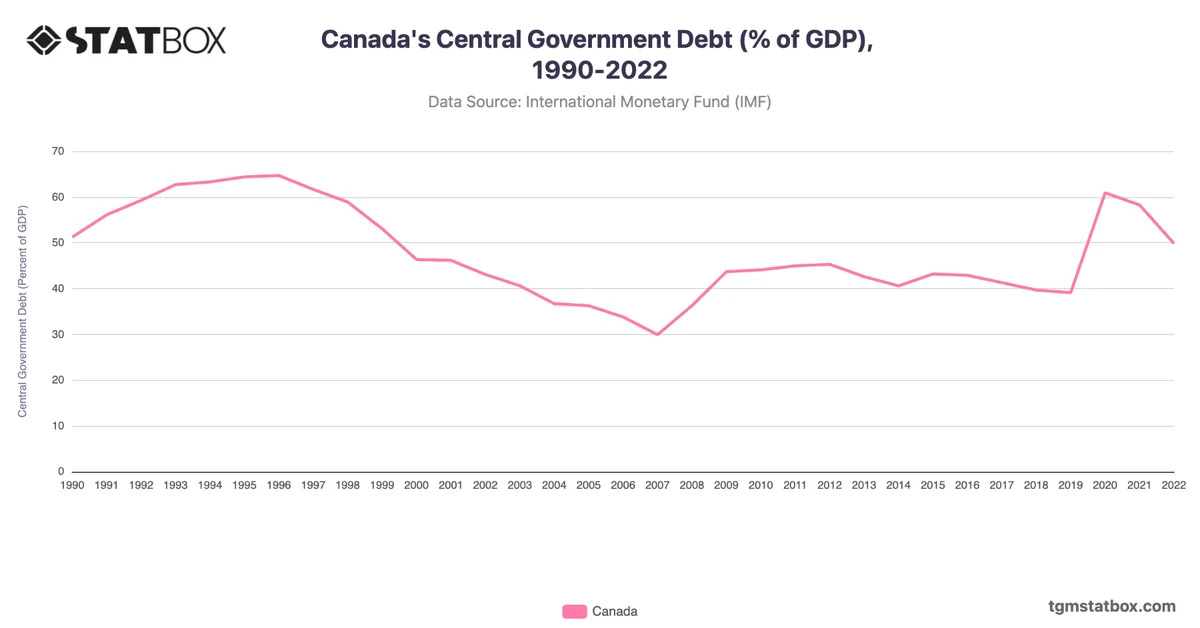
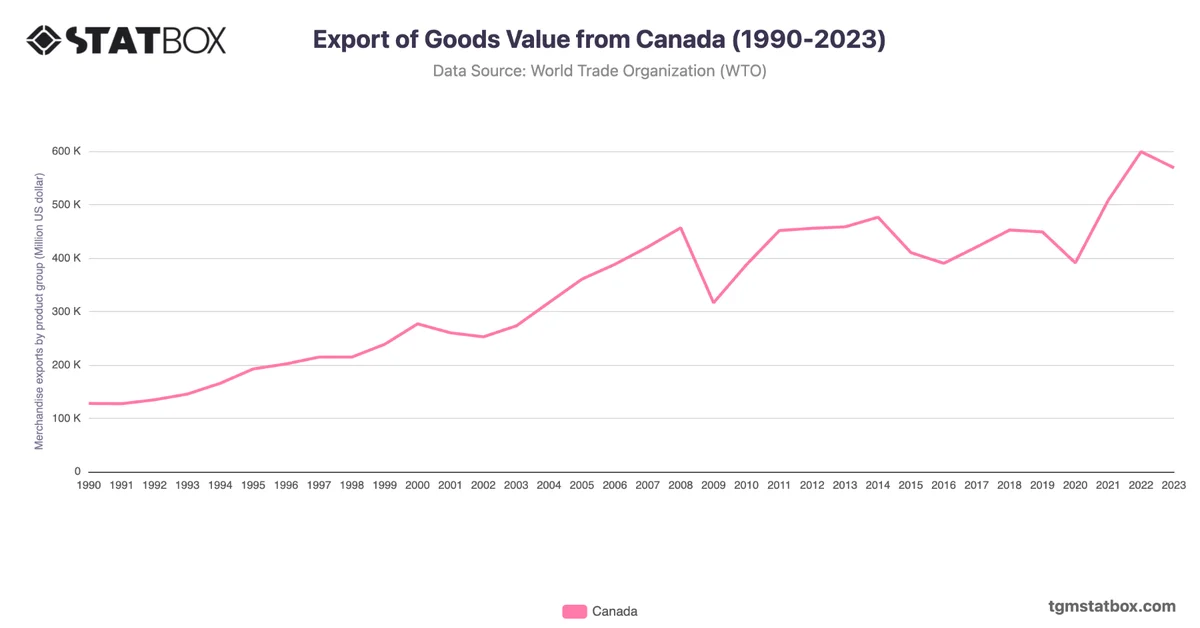
The 1990s experienced periods of stagnation, notably during the early years of the decade, reflecting global economic uncertainty and adjustments in fiscal policies. Recovery gained momentum in the late 1990s, reaching 5.1% in 1999 and 2000, driven by technological advancements and trade agreements, including NAFTA. However, the 2008 global financial crisis severely impacted Canada, resulting in a contraction of -2.9% in 2009.
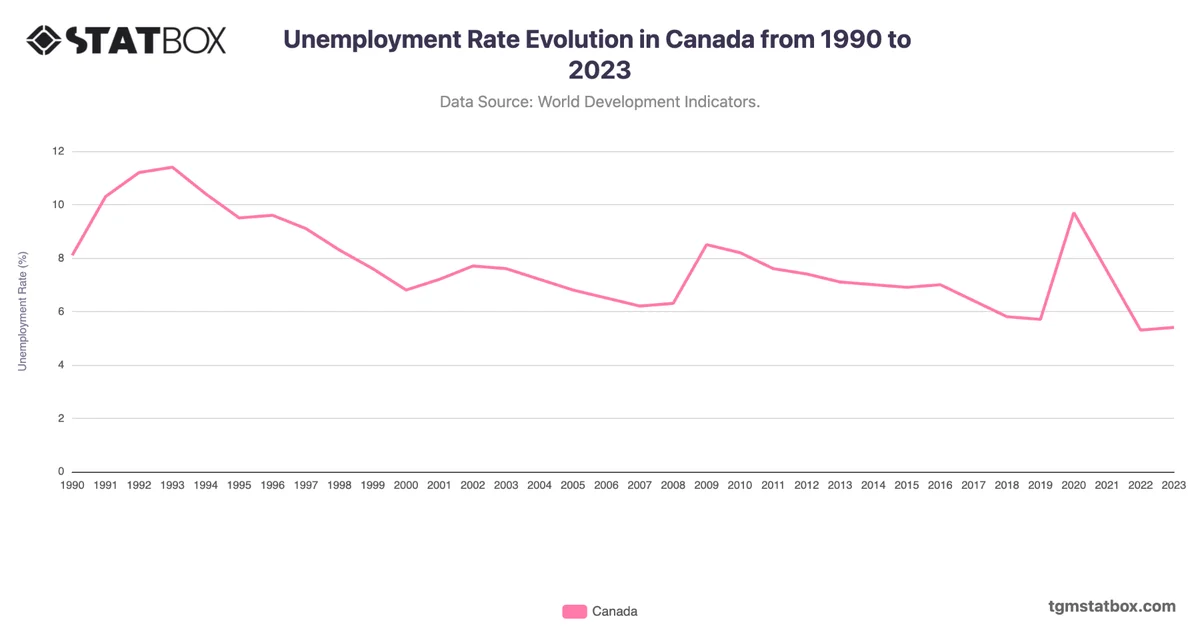
The country rebounded post-crisis, but economic volatility persisted, with growth declining to -5.0% in 2020 due to the COVID-19 pandemic. Recovery efforts, supported by government stimulus and resilient export sectors, pushed growth to 5.3% in 2021. The latest estimate in 2023 shows a modest increase of 1.1%, reflecting ongoing global economic challenges.
For a broader context, visit other statistics on Canada’s population count, Canada’s yearly GDP figures, Canada population growth trends.