Kenya's military expenditure showed significant fluctuations between 1964 and 2022, shaped by regional tensions and domestic factors. From 0.6% of GDP in 1964, spending steadily rose, peaking at 5.5% in 1979 due to increased military activity and geopolitical instability in East Africa, including the Ogaden War and Kenya's strategic positioning during the Cold War. By the early 1980s, expenditure began to decline, dropping to 2.4% in 1985, reflecting a period of relative political stability and economic constraints.
From the 1990s onward, Kenya maintained a more conservative defense budget, typically below 2% of GDP. Post-2000, increased spending aligned with security challenges posed by terrorism and cross-border threats, particularly from Al-Shabaab in Somalia. Despite this, military expenditure consistently hovered around 1.5% of GDP in the 2010s and declined slightly to 1.0% by 2022, indicating improved stability and fiscal prioritization of development initiatives over defense.
From the 1990s onward, Kenya maintained a more conservative defense budget, typically below 2% of GDP. Post-2000, increased spending aligned with security challenges posed by terrorism and cross-border threats, particularly from Al-Shabaab in Somalia. Despite this, military expenditure consistently hovered around 1.5% of GDP in the 2010s and declined slightly to 1.0% by 2022, indicating improved stability and fiscal prioritization of development initiatives over defense.
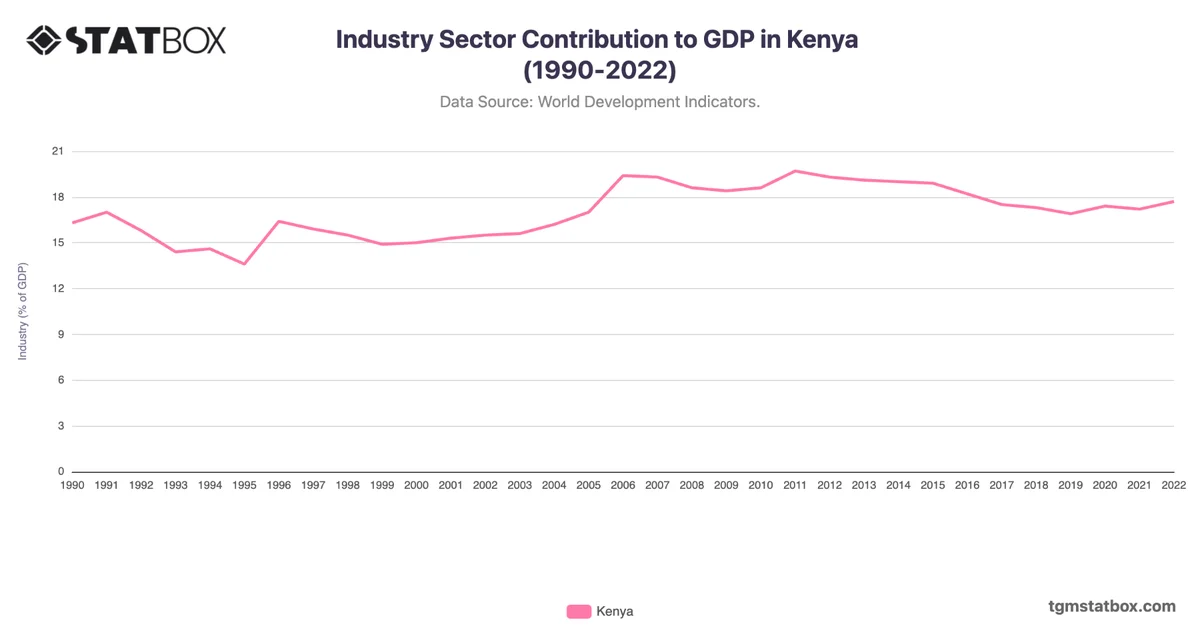
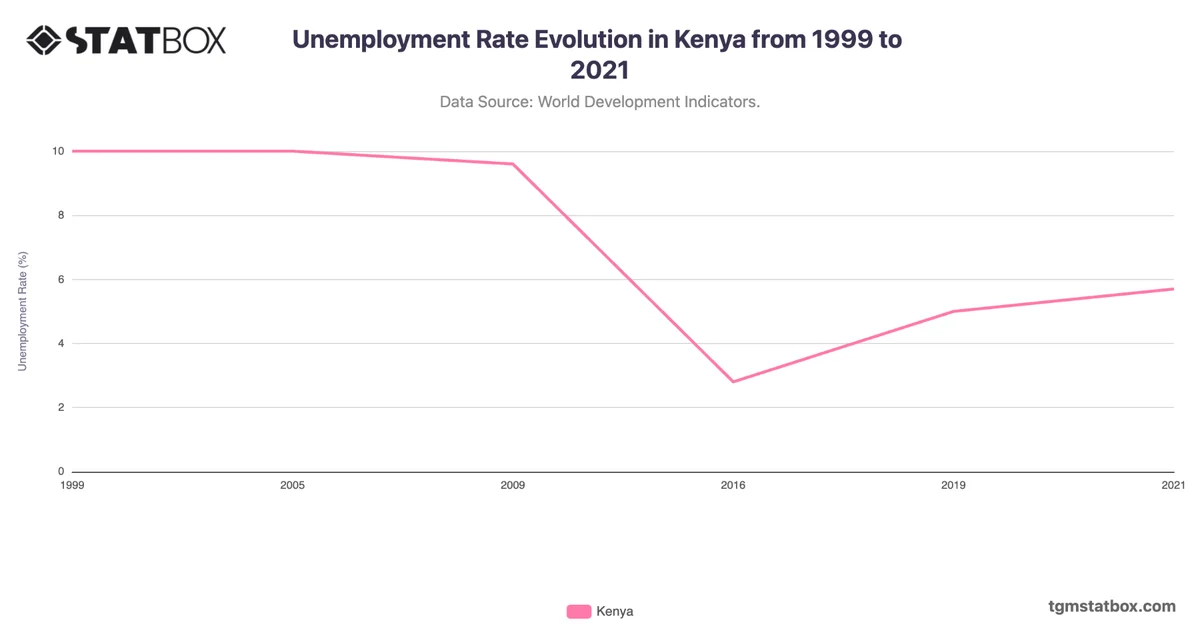
For a deeper dive into the topic, explore Industry sector’s share in Kenya’s GDP, Kenya’s net ODA data, Kenya’s unemployment rate.