Canada's military personnel numbers declined during the 1990s due to post-Cold War defense budget cuts. Starting at 87,000 in 1990, levels fell to 57,000 by 2001. This period marked a focus on downsizing and reallocating resources toward modernization.
From 2004 onward, personnel levels rebounded, reaching 66,000 in 2010 and maintaining this figure through 2016. This increase aligns with Canada’s active role in global peacekeeping and counterterrorism missions, reflecting its commitment to defense readiness in a changing global landscape.
From 2004 onward, personnel levels rebounded, reaching 66,000 in 2010 and maintaining this figure through 2016. This increase aligns with Canada’s active role in global peacekeeping and counterterrorism missions, reflecting its commitment to defense readiness in a changing global landscape.
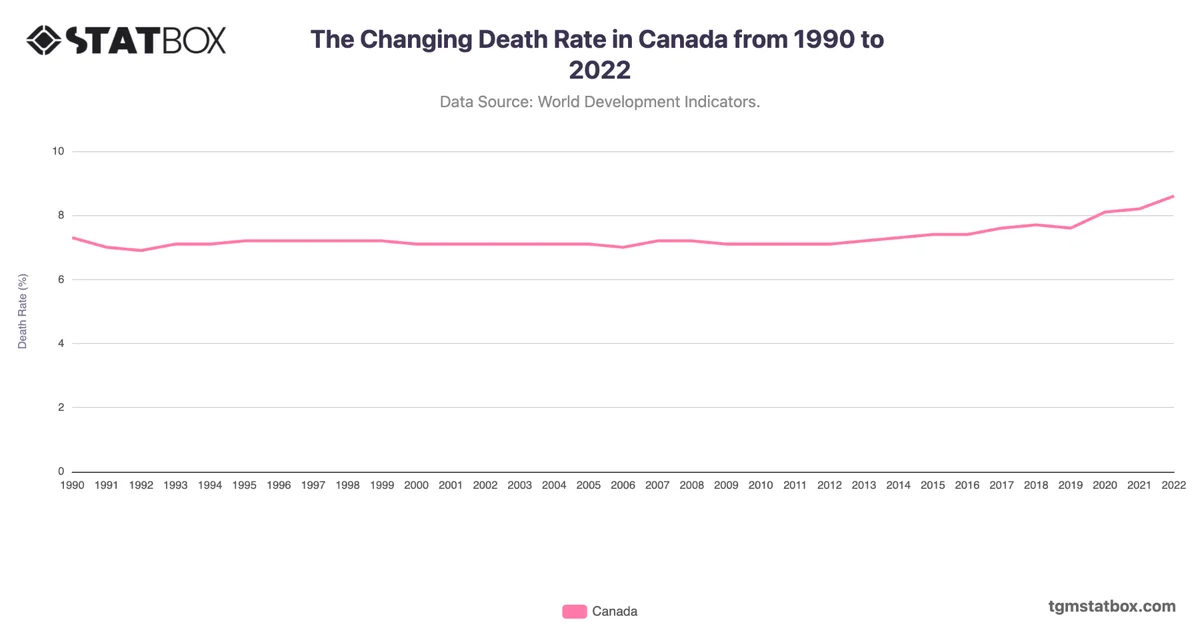
For a deeper dive into the topic, explore Canada’s death rate trend, Canada’s manufacturing contribution to GDP, Canada’s public debt as a share of GDP.