The "Population Growth Trends in China from 1990 to 2023" chart captures a sharp and continuous decline in growth rates, reflecting China’s demographic shifts due to policy and social changes over the past three decades.
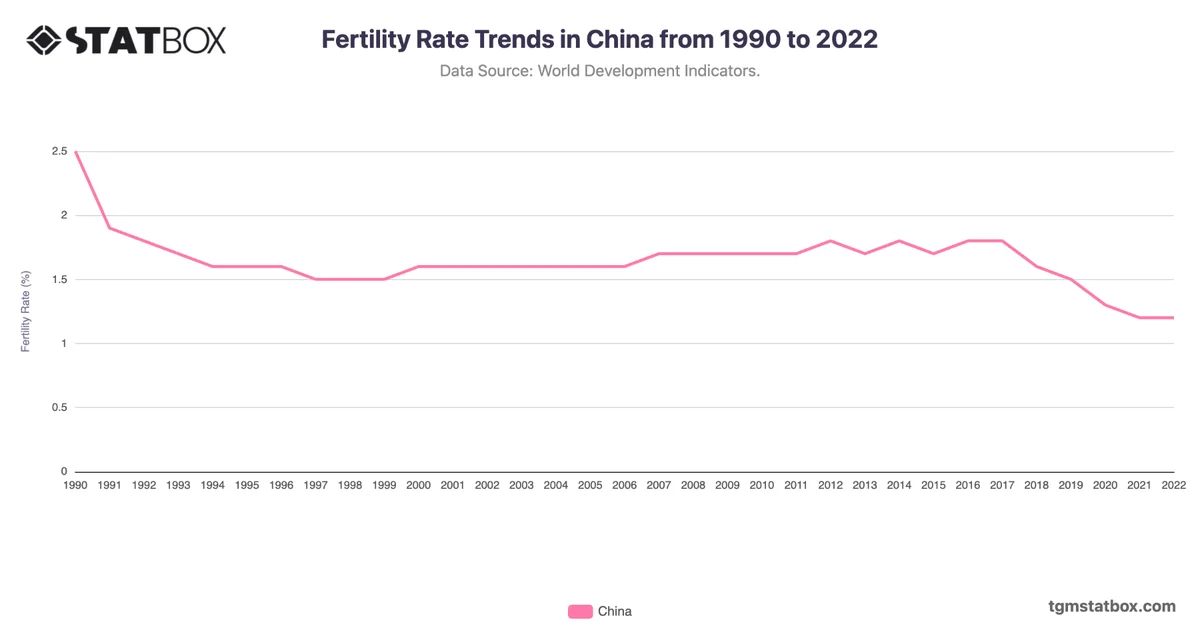
In 1990, China’s growth rate stood at 1.5%, but it quickly decreased as the effects of the one-child policy, implemented in 1979, took hold. By 1999, the rate had dropped to 0.9%, with growth gradually decreasing further into the early 2000s, reaching 0.5% by 2007. During this period, urbanization, rising living costs, and smaller family norms contributed to lower birth rates.
An attempt to stabilize growth in 2013 allowed a temporary uptick to 0.7%, partially due to relaxed family planning policies. However, these effects were short-lived, and the growth rate resumed its decline, falling to 0.4% in 2019. The COVID-19 pandemic’s impact on family planning and economic conditions further contributed to the downward trend, with growth rates dropping to 0.2% by 2020 and reaching zero by 2022. By 2023, China recorded a negative growth rate of -0.1%, marking a historic population decline.
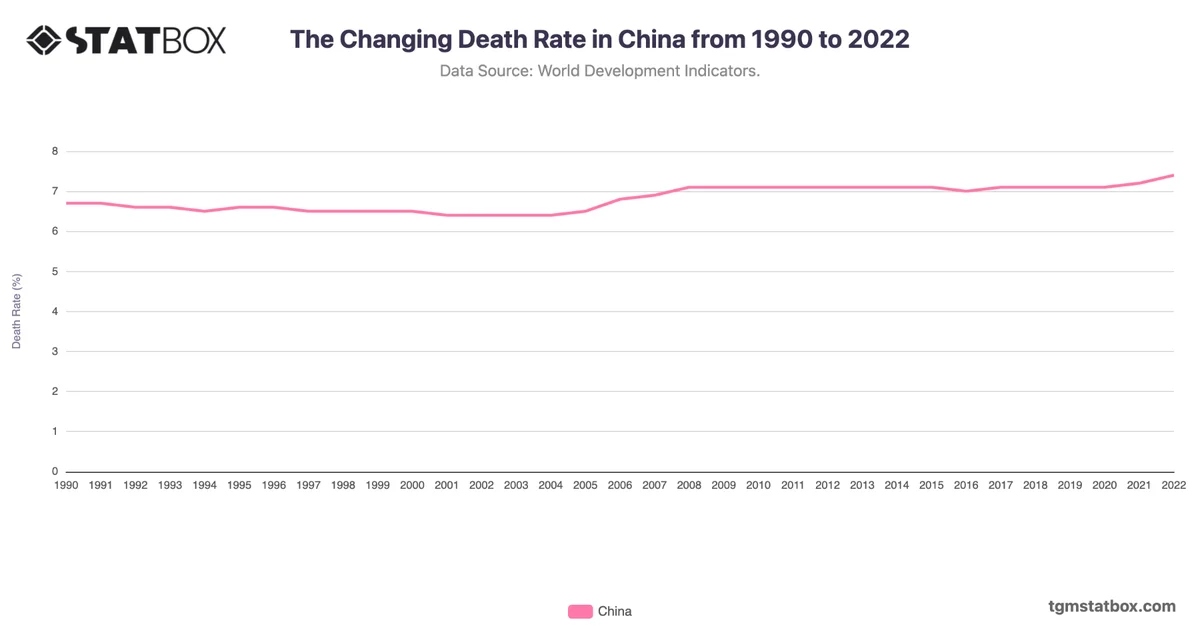
This downward trend signals China’s shift toward an aging population, raising significant implications for the workforce, economic sustainability, and healthcare. These demographic changes underscore the challenges China faces in adapting to a shrinking and aging population, with strategic shifts likely needed in social and economic policies to balance these new realities.
In 1990, China’s growth rate stood at 1.5%, but it quickly decreased as the effects of the one-child policy, implemented in 1979, took hold. By 1999, the rate had dropped to 0.9%, with growth gradually decreasing further into the early 2000s, reaching 0.5% by 2007. During this period, urbanization, rising living costs, and smaller family norms contributed to lower birth rates.
An attempt to stabilize growth in 2013 allowed a temporary uptick to 0.7%, partially due to relaxed family planning policies. However, these effects were short-lived, and the growth rate resumed its decline, falling to 0.4% in 2019. The COVID-19 pandemic’s impact on family planning and economic conditions further contributed to the downward trend, with growth rates dropping to 0.2% by 2020 and reaching zero by 2022. By 2023, China recorded a negative growth rate of -0.1%, marking a historic population decline.
This downward trend signals China’s shift toward an aging population, raising significant implications for the workforce, economic sustainability, and healthcare. These demographic changes underscore the challenges China faces in adapting to a shrinking and aging population, with strategic shifts likely needed in social and economic policies to balance these new realities.
For a broader context, visit other statistics on China’s annual GDP growth rate, China’s annual GDP figures, China’s population density.