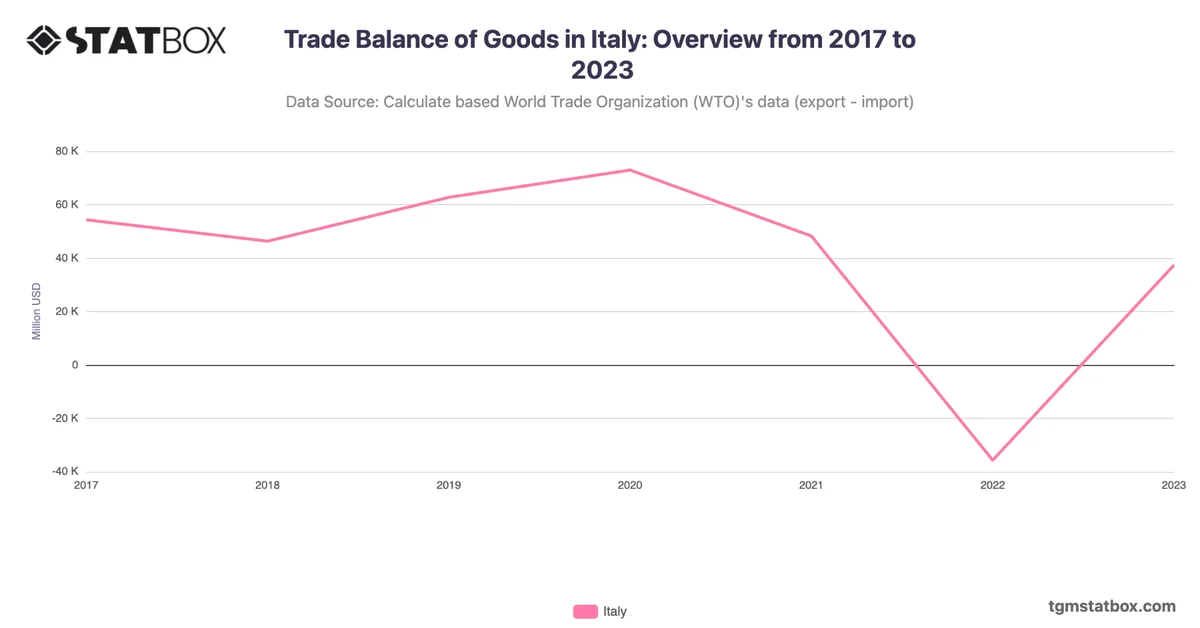
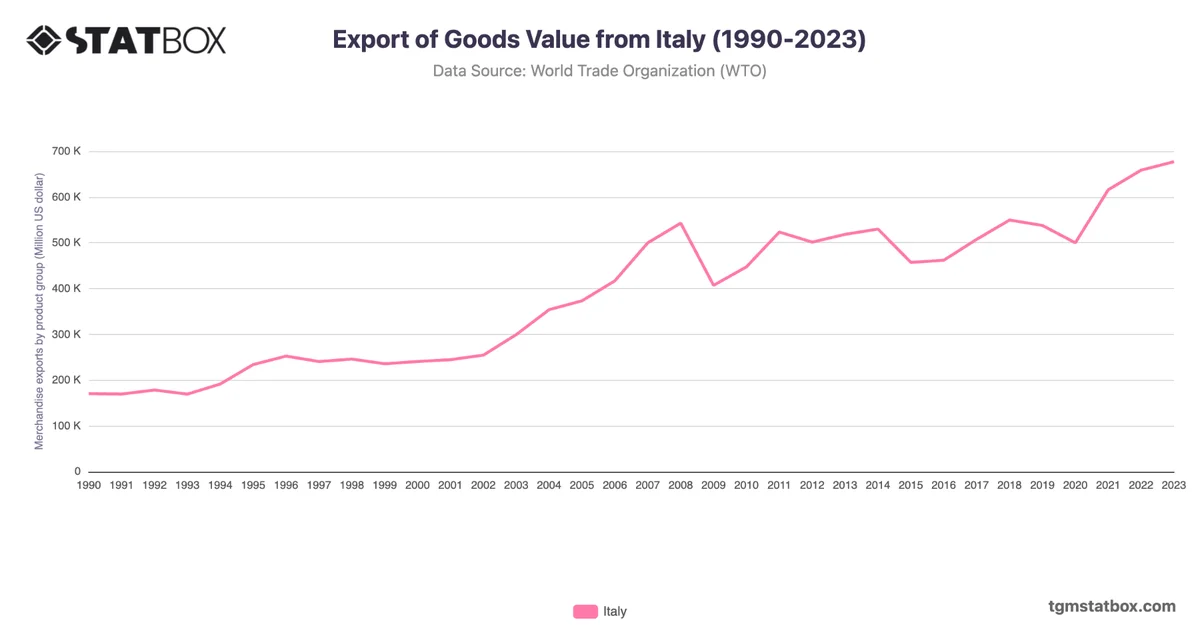
Italy's import value showcased steady growth over the decades, increasing from $181.9B in 1990 to a peak of $694.3B in 2022. In the 1990s, imports rose moderately, driven by industrial expansion and increased integration into the European Union’s single market. The early 2000s saw a significant rise, with imports reaching $355.3B in 2004, fueled by globalization and Italy’s strong manufacturing sector.
The financial crisis of 2008 caused a sharp decline to $415.1B in 2009, but recovery was evident by 2011, with imports climbing back to $558.8B. The pandemic led to another dip to $426.8B in 2020, followed by a rapid recovery in 2021 and a new high in 2022, driven by increased energy imports and industrial goods. By 2023, imports stabilized at $639.8B, reflecting Italy’s resilience and its diversified trade portfolio.
The financial crisis of 2008 caused a sharp decline to $415.1B in 2009, but recovery was evident by 2011, with imports climbing back to $558.8B. The pandemic led to another dip to $426.8B in 2020, followed by a rapid recovery in 2021 and a new high in 2022, driven by increased energy imports and industrial goods. By 2023, imports stabilized at $639.8B, reflecting Italy’s resilience and its diversified trade portfolio.
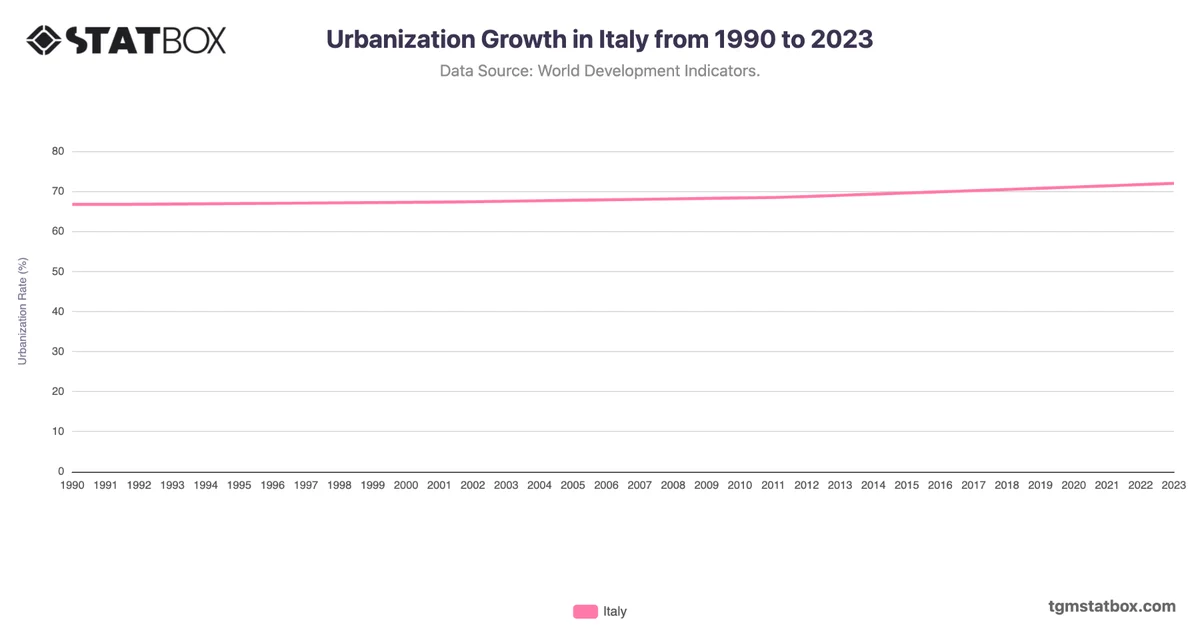
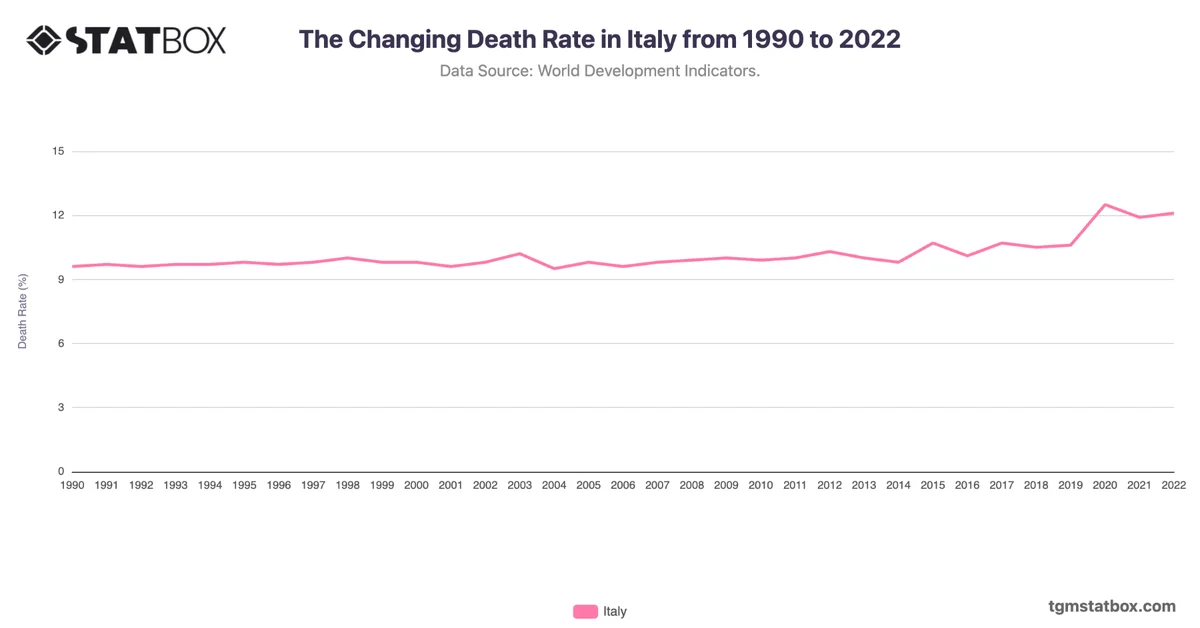
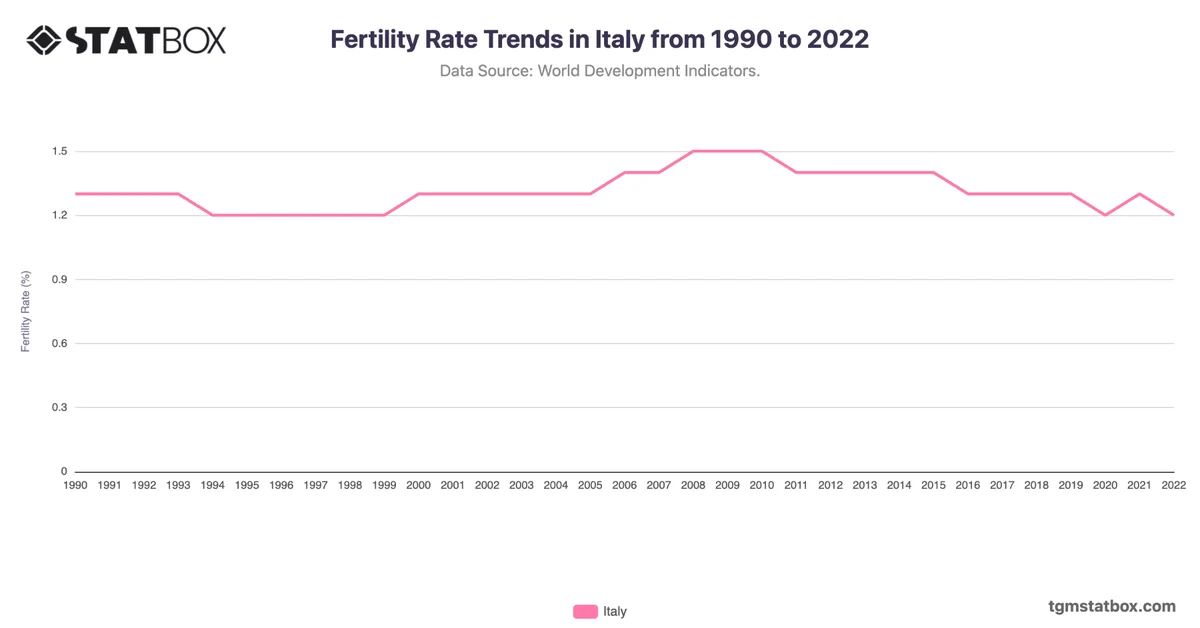
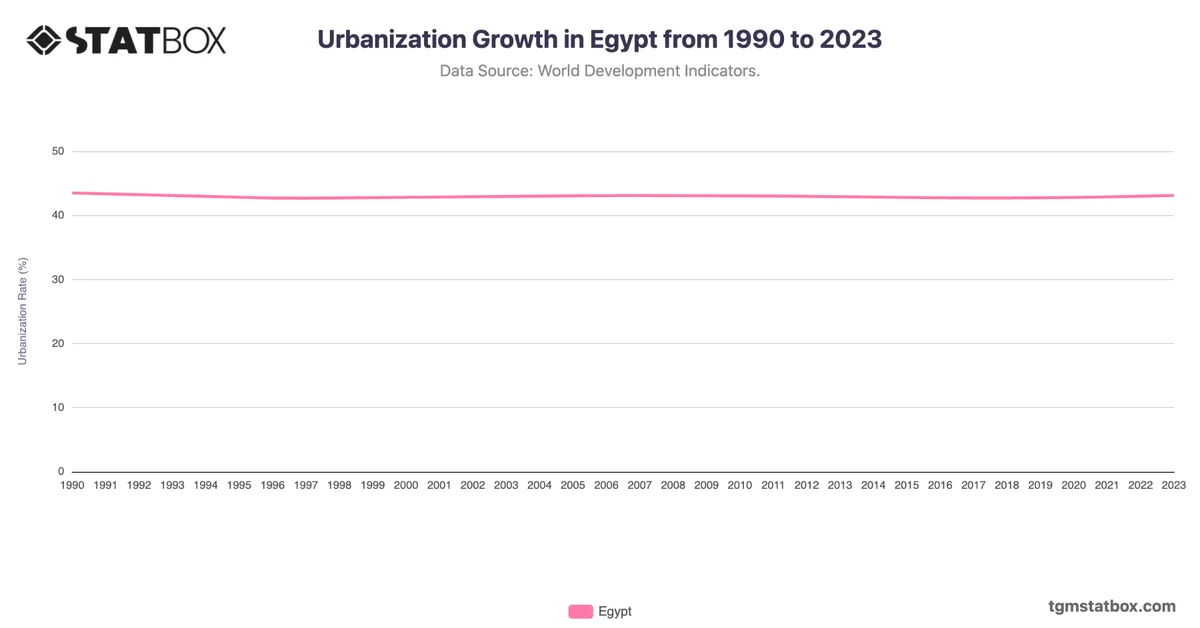
Explore related charts to gain a better understanding of Italy’s annual GDP growth rate, rise in Italy’s urbanization, Italy’s services sector share in GDP.