Concentration of Christmas Gift Spending Within Moderate Budget Ranges
Gift-giving during the Christmas period represents one of the most significant seasonal consumption events in consumer calendars. Budgeting decisions in this context involve trade-offs between personal relationships, household finances, and category priorities, making spending range distribution a meaningful indicator of consumer financial confidence and gifting intent.
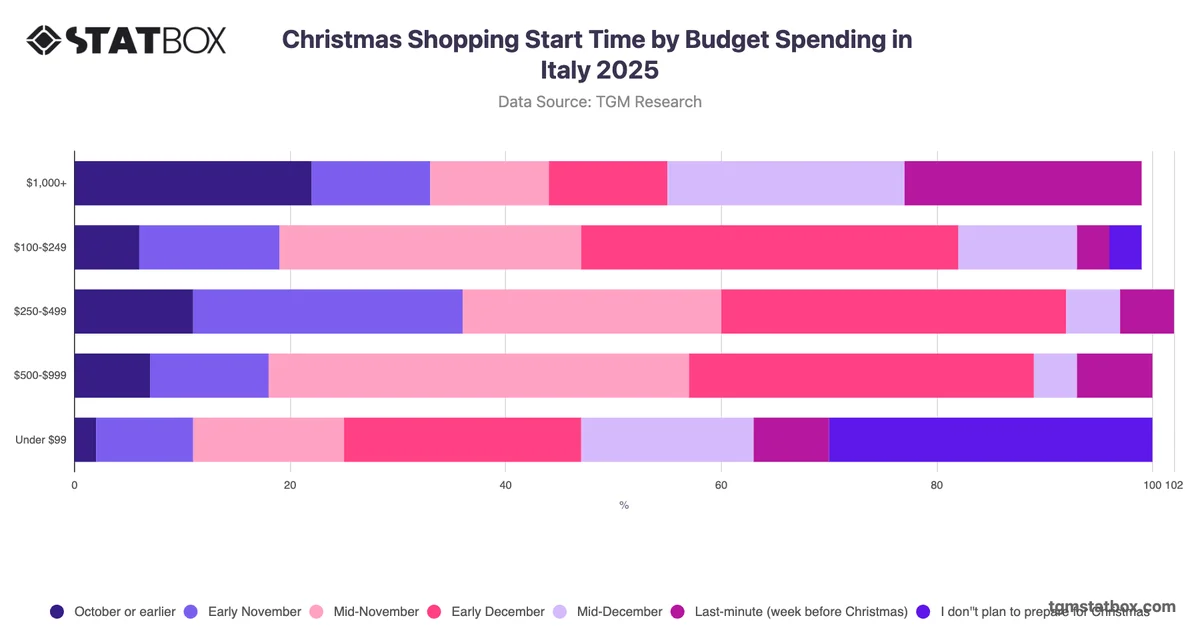
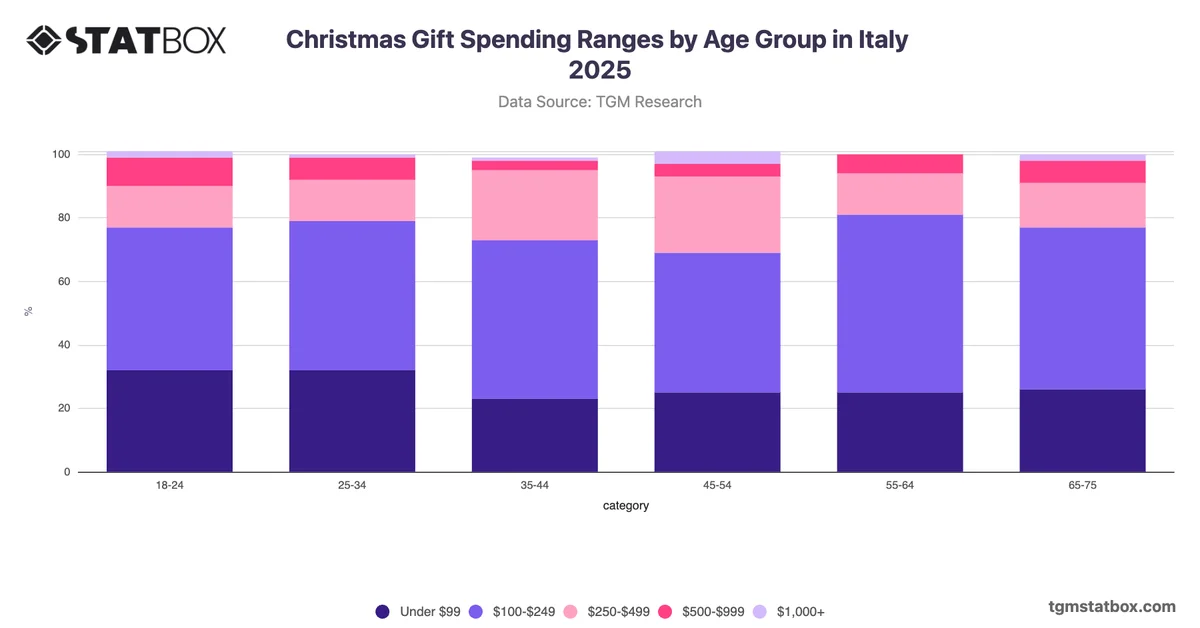
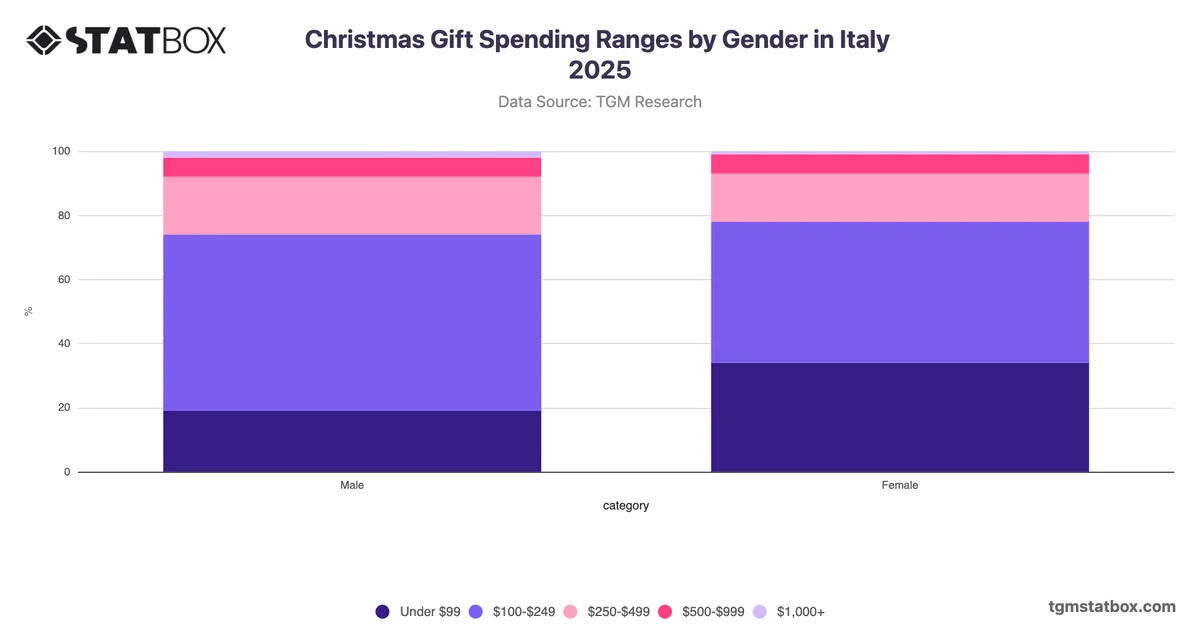
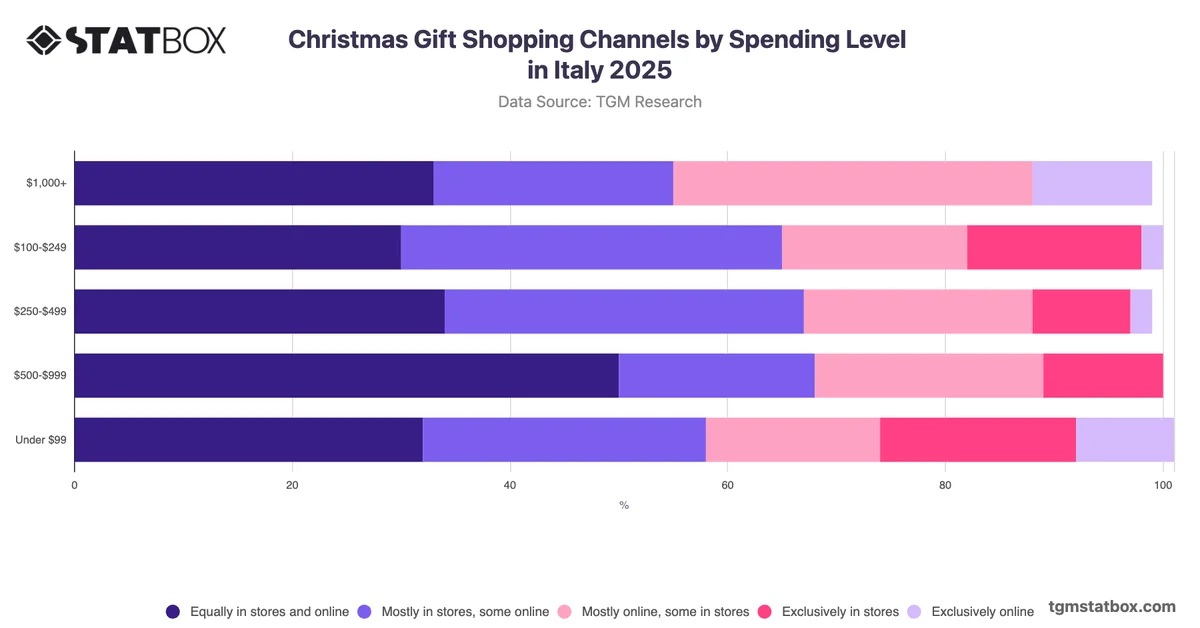
The dominant pattern in Italian Christmas gift spending is a strong concentration within the moderate budget tier. Nearly half of consumers plan to spend between $100 and $249, and when combined with those spending under $99, the sub-$250 segment accounts for approximately three in four consumers. This concentration suggests that the majority of Italian gift buyers operate within clearly defined, relatively conservative financial limits rather than treating the season as an occasion for elevated discretionary outlay. High-end spending above $500 remains limited to fewer than one in ten consumers, indicating that premium gifting is a narrow rather than mainstream behaviour. For retailers and brands targeting this market, the implication is that communications and product assortments centred on the $100 to $249 range are likely to address the broadest addressable audience, while premium positioning may warrant distinct segmentation strategies to reach the smaller but distinct high-spend group effectively.