Gender Differences in Christmas Shopping Channel Preferences
Christmas gift purchasing represents one of the most commercially significant consumer behaviour periods of the year. The channel through which shoppers choose to buy, whether physical retail, digital platforms, or a combination of both, has direct implications for how retailers plan inventory, staffing, promotions, and fulfilment strategies across the holiday season.
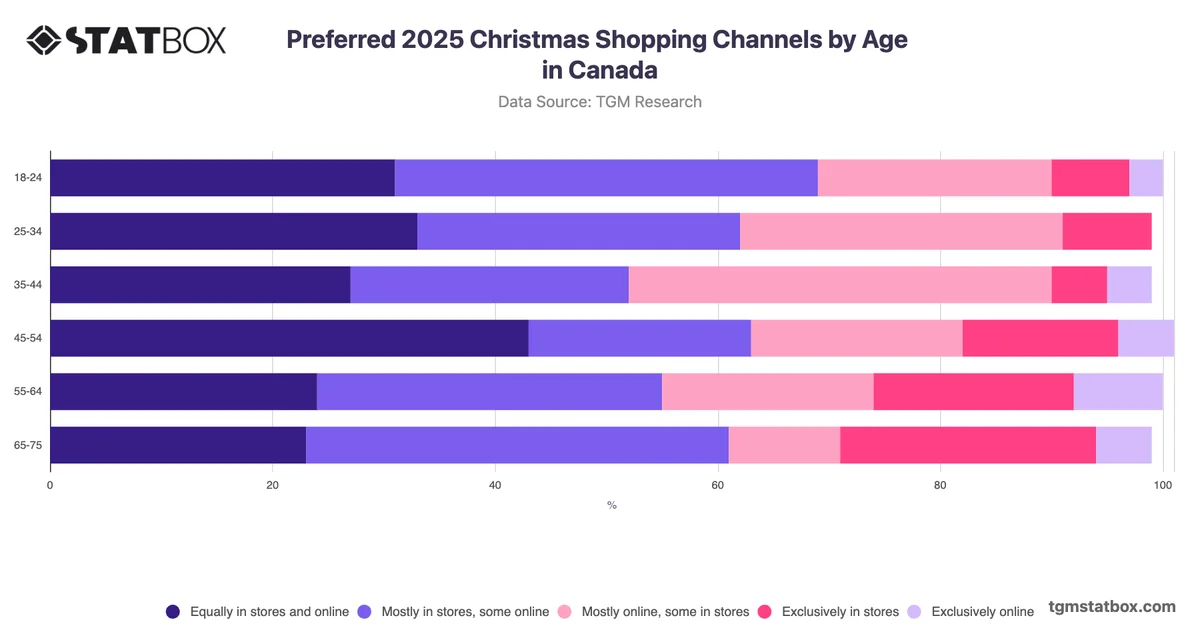
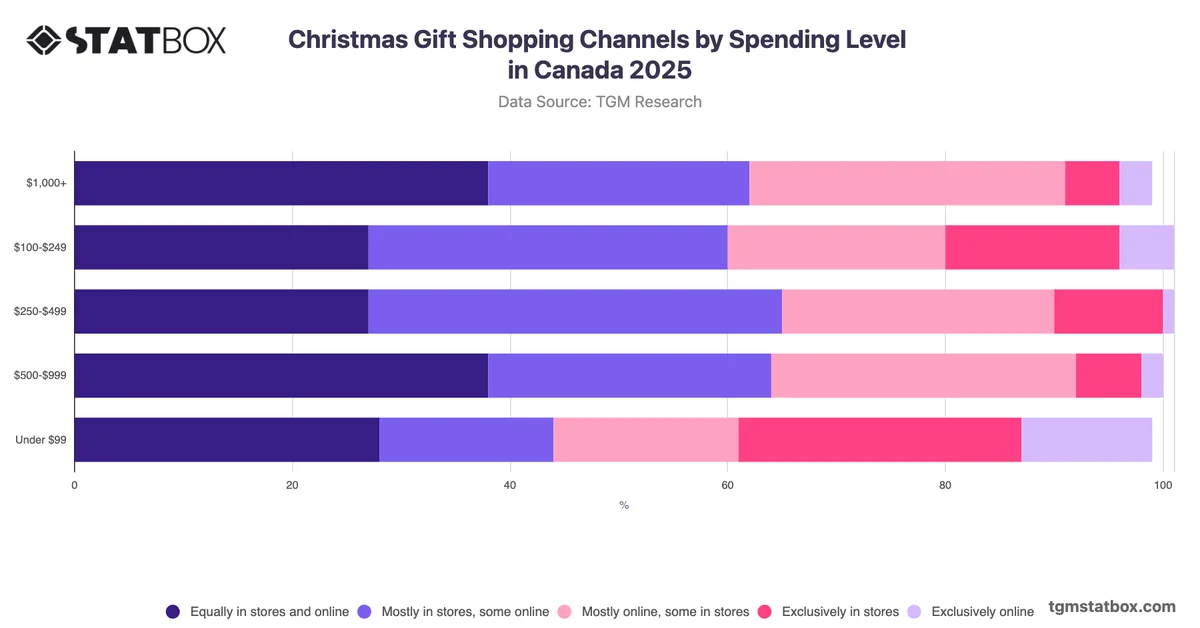
The most analytically notable pattern in Canadian Christmas shopping preferences is not the dominance of any single channel, but rather the concentration of both male and female shoppers around blended approaches rather than exclusive commitments. Among men, a slight lean toward physical retail is apparent, with 32% planning to shop mostly in stores with some online activity, compared to 27% of women in the same category. Women, by contrast, are more likely to split their activity equally across both channels at 34%, the single largest response among female shoppers. Purely digital or purely physical approaches attract relatively limited support from either group, suggesting that omnichannel availability remains a practical expectation rather than a preference. Retailers planning 2025 Christmas campaigns should prioritise consistent pricing, product availability, and promotional messaging across both channels, particularly targeting female shoppers who are most likely to move fluidly between them.