Channel Mix Preferences Across Canadian Christmas Gift Spending Tiers
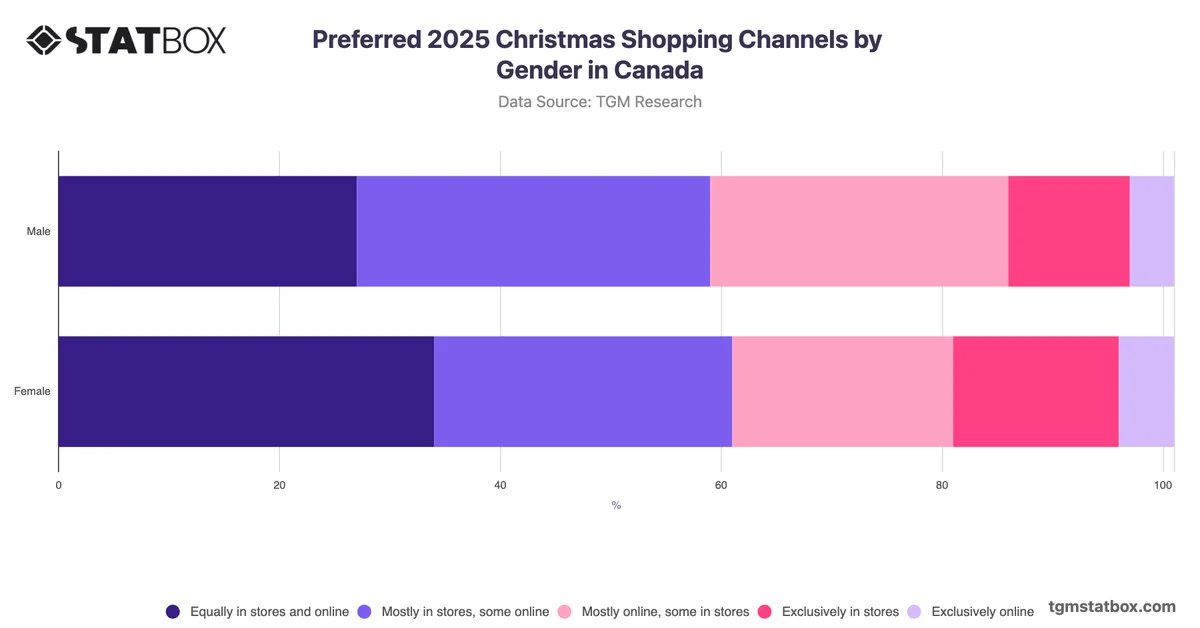
Christmas gift purchasing involves a range of channel decisions, from physical retail to digital platforms, with many consumers combining both. The balance a shopper strikes between in-store and online options is closely tied to the scale and nature of their intended expenditure, making spending level a meaningful lens for understanding channel strategy.
The most notable pattern across Canadian Christmas gift shoppers is that blended channel behaviour, combining in-store and online purchasing to varying degrees, predominates at higher spending levels, while lower-budget shoppers are considerably more polarised. Among those spending under $99, 26% shop exclusively in stores and 12% exclusively online, a combined exclusive-channel rate of 38% that far exceeds any higher spending tier. By contrast, shoppers at the $500 to $999 and $1,000 or more levels cluster heavily around mixed-channel approaches, with roughly two-thirds or more in each group splitting purchases across both formats. This suggests that higher expenditure is associated with greater channel flexibility rather than loyalty to a single format. For retailers, this points to the value of investing in integrated fulfilment and cross-channel product discovery specifically for mid-to-high budget segments, while maintaining distinct in-store propositions for lower-spending shoppers who remain more likely to purchase exclusively in person.