Age-Based Variation in Christmas Shopping Channel Preferences
Canadian consumers approach holiday gift purchasing through a combination of physical retail and digital channels, with individual preferences shaped by factors including convenience, product type, and familiarity with each channel. Understanding how these preferences vary across age groups is central to effective retail planning and channel investment decisions.
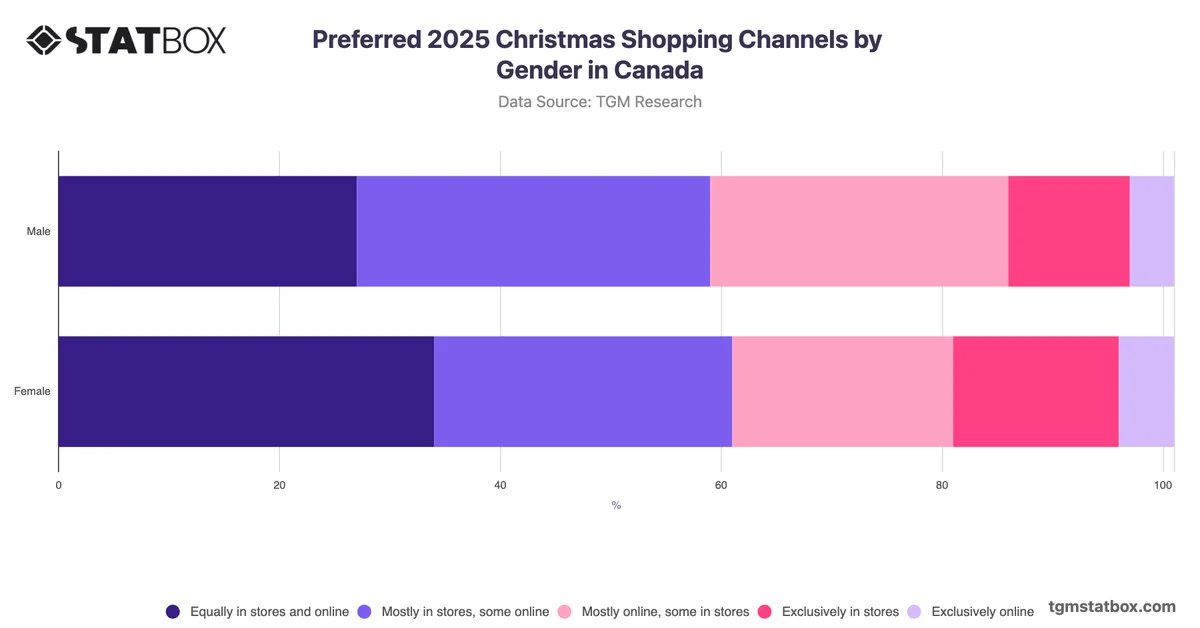
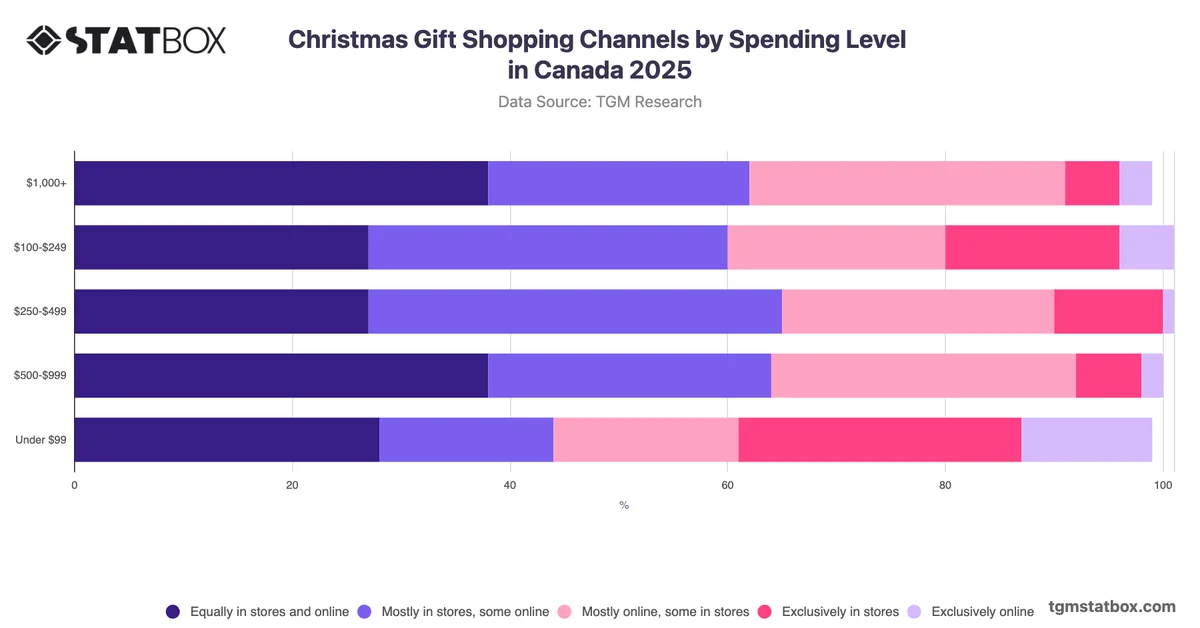
The most notable pattern in Canadian Christmas shopping preferences is not a uniform move toward online purchasing but rather a meaningful divergence by age group in how consumers combine channels. The 35–44 cohort stands out as the most digitally oriented, with 38% preferring mostly online with some in-store shopping, a notably higher proportion than any other age group. By contrast, older Canadians aged 65–75 lean toward physical retail, with 23% shopping exclusively in stores and 38% mostly in stores with limited online activity. Middle-aged respondents aged 45–54 show the strongest preference for an equal split between channels at 43%. This pattern suggests that omnichannel retail strategies cannot be applied uniformly across age segments. Retailers planning 2025 Christmas campaigns may benefit from tailoring channel emphasis and fulfilment messaging specifically to the 35–44 and 65–75 segments, given the pronounced divergence in their respective channel commitments.