Gender Alignment and Divergence in Christmas Purchase Criteria
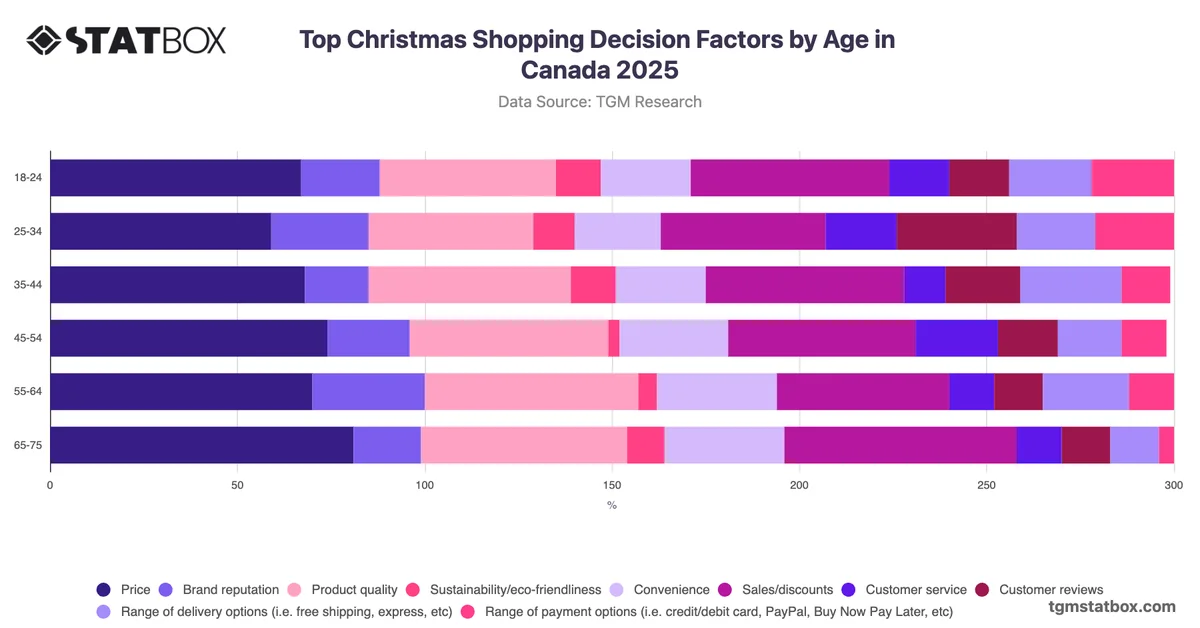
Christmas shopping decisions involve a complex interplay of financial, logistical, and reputational considerations. For Canadian consumers, the relative weight assigned to each factor can vary by gender, with implications for how retailers and brands structure their messaging, promotional strategies, and channel investment during the peak holiday season.
The most analytically notable pattern in Canadian Christmas shopping behaviour is not where men and women differ, but where they converge. Product quality registers at 52% for both genders, and convenience is nearly identical across groups, pointing to a shared baseline of purchase criteria. The clearest divergence appears in two areas: sales and discounts, where women outpace men by 12 percentage points (57% versus 45%), and brand reputation, where men score 9 points higher than women (27% versus 18%). This suggests that promotional mechanics are a stronger driver for female shoppers, while brand equity carries relatively greater weight among male shoppers. Retailers planning holiday campaigns may find value in testing gender-segmented messaging, directing discount and value-led communications toward female audiences while reinforcing brand credibility signals in content targeting male consumers.