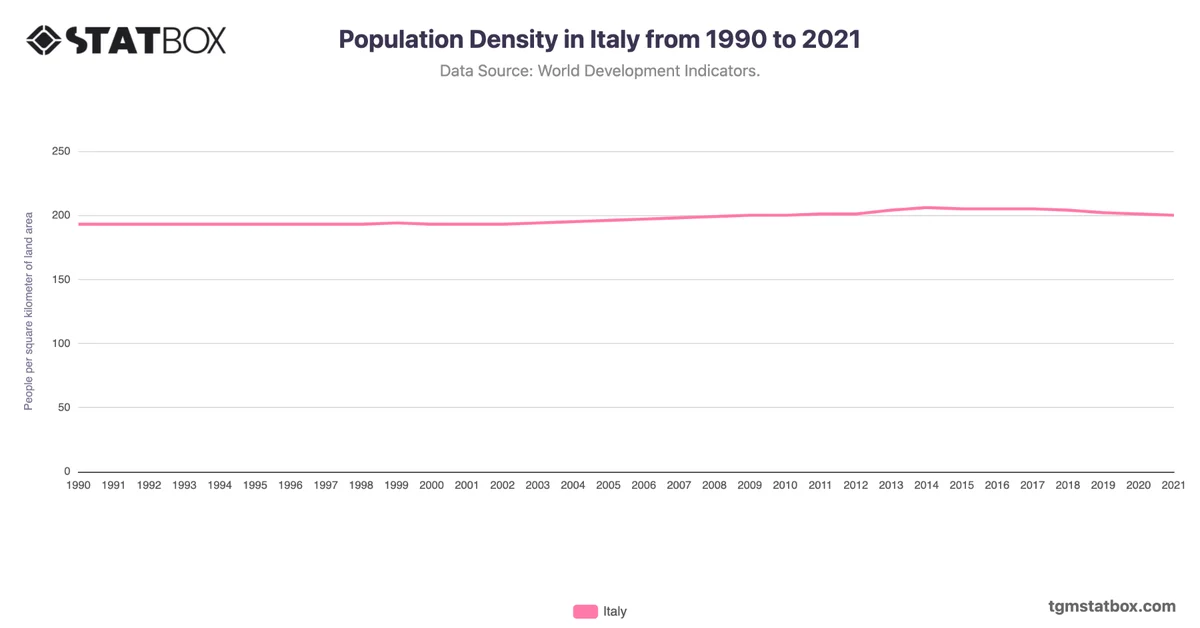
Italy's population growth displayed relative stagnation for much of the analyzed period, with low annual rates of 0.1% or less through the 1990s and early 2000s. Growth temporarily increased in the mid-2000s, peaking at 0.7% in 2008, driven by higher immigration from Eastern Europe and North Africa. However, by 2015, Italy's growth entered a negative trajectory (-0.1%) due to declining birth rates, aging demographics, and economic challenges.
From 2019 onwards, negative growth deepened to -1.2% as economic uncertainty and emigration further impacted the population. While recent years (2020–2023) show a slight improvement to -0.3%, this reflects policy efforts to stabilize population loss, but Italy continues to grapple with structural challenges in rejuvenating its demographic profile.
From 2019 onwards, negative growth deepened to -1.2% as economic uncertainty and emigration further impacted the population. While recent years (2020–2023) show a slight improvement to -0.3%, this reflects policy efforts to stabilize population loss, but Italy continues to grapple with structural challenges in rejuvenating its demographic profile.
Gain a broader perspective by reviewing Italy’s military personnel proportion, Italy’s changing median age, Italy’s working-age population share.