The GDP growth rate of Côte d'Ivoire from 1961 to 2023 reflects a fascinating economic journey shaped by periods of remarkable expansion, political instability, and external shocks. The early 1960s saw steady growth, but by 1965, a sharp decline of -3.1% occurred, likely linked to external economic pressures. Despite this, Côte d'Ivoire bounced back impressively with a stunning 17.6% growth in 1964, supported by booming cocoa and coffee exports.
The 1970s and early 1980s continued with fluctuations, marked by robust growth such as 12.9% in 1976, followed by periods of economic difficulty. The year 1980 recorded a significant contraction of -11%, highlighting the impact of global market volatility and internal political challenges. From the mid-1980s to the early 2000s, Côte d'Ivoire faced persistent instability, resulting in minimal growth and periods of contraction, with 2000 experiencing another dip at -0.3%.
However, beginning in 2012, a dramatic recovery began to take shape, signaling a new era for the country. Post-conflict stability, governance reforms, and infrastructure development fueled steady economic growth, with GDP peaking at 10.8% in 2013. This upward trajectory was maintained throughout the 2010s, making Côte d'Ivoire one of the fastest-growing economies in Africa. In 2021, despite the challenges posed by the COVID-19 pandemic, growth rebounded to 7.1%, further confirming the resilience of the Ivorian economy.
Despite several challenging decades, Côte d'Ivoire’s economic recovery has been impressive in recent years, driven by investments in agriculture, infrastructure, and reforms that have set the stage for sustained growth.
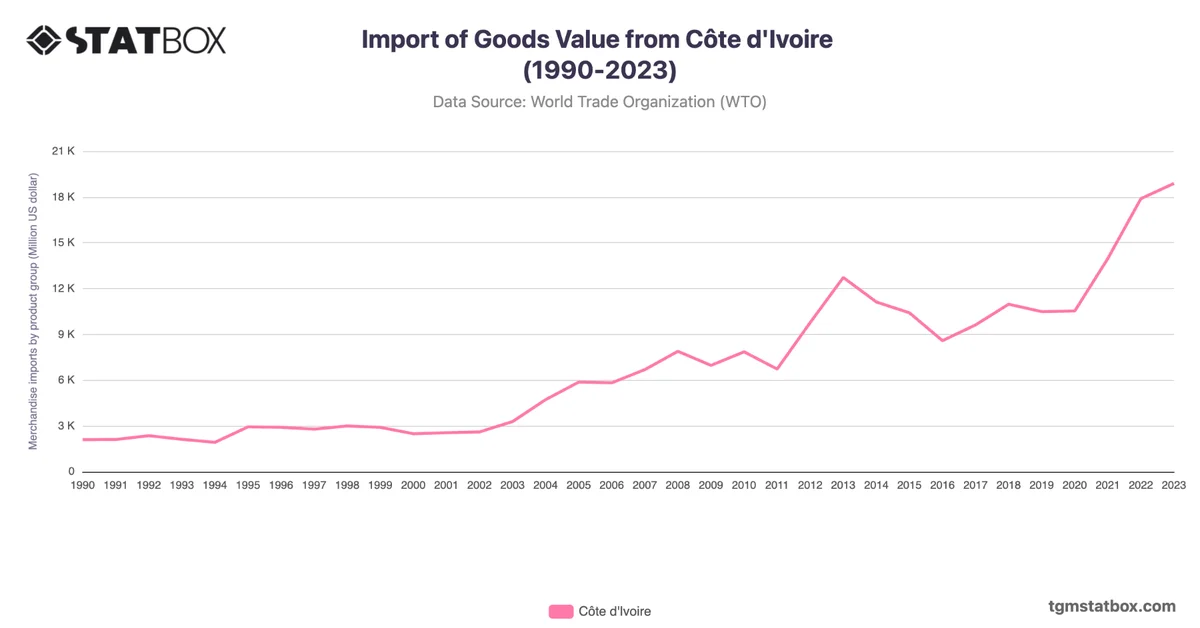
For a broader context, visit other statistics on Côte d'Ivoire’s goods import value, Côte d’Ivoire’s annual GDP, Côte d’Ivoire’s yearly net ODA.