Croatia's fertility rate demonstrated relative stability, starting at 1.6 in 1990 and fluctuating minimally over the following decades. The rate dipped to 1.4 in the late 1990s, coinciding with the war and economic challenges, before recovering slightly to 1.6 in 2021.
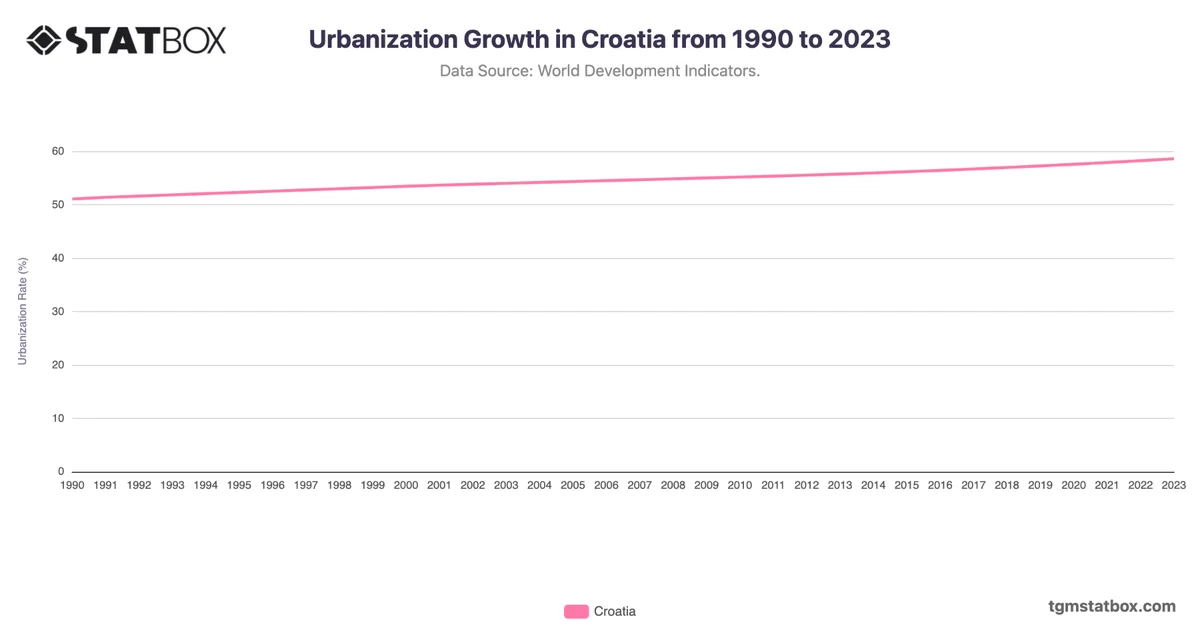
These fluctuations reflect broader demographic trends, such as urbanization and delayed parenthood. Despite efforts to encourage higher birth rates, the rate remained at 1.5 by 2022, indicative of persistent economic and societal factors limiting growth.
These fluctuations reflect broader demographic trends, such as urbanization and delayed parenthood. Despite efforts to encourage higher birth rates, the rate remained at 1.5 by 2022, indicative of persistent economic and societal factors limiting growth.
For a deeper dive into the topic, explore Croatia’s population count, Croatia's population trends, rise in urbanization in croatia.