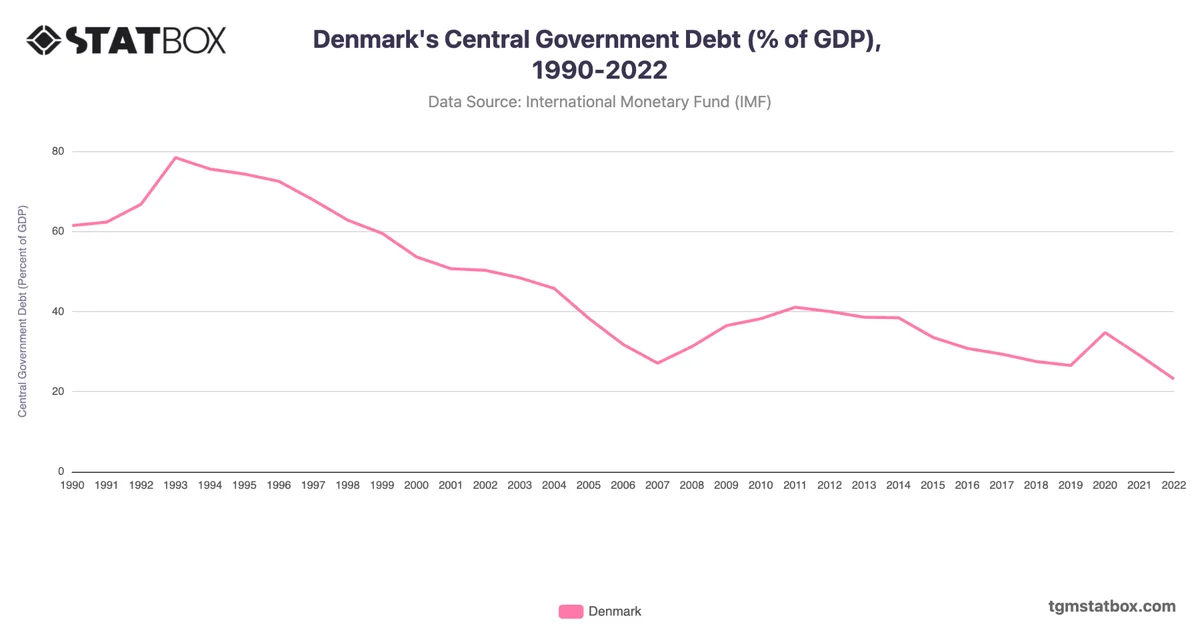
Denmark saw a notable decrease in its government debt-to-GDP ratio from the early 1990s to the early 2000s. In 1990, the debt ratio stood at 69.4% and rose slightly to 78.6% by 1993, driven largely by economic stagnation and high social spending. By the late 1990s, Denmark’s commitment to fiscal discipline led to gradual reductions in the debt ratio, falling to 52.4% in 2000, as economic reforms and a stronger economy supported a reduction in borrowing needs.
The 2008 financial crisis saw Denmark’s debt rise again, reaching 40.2% in 2009, as the government enacted stimulus measures to support the economy. However, disciplined fiscal management helped reduce the debt ratio through the 2010s, with debt as low as 33.7% in 2019. The COVID-19 pandemic caused a temporary spike in 2020 to 42.2%, but by 2022, Denmark had reduced this to 29.7% amid strong post-pandemic economic recovery and prudent fiscal policies.
The 2008 financial crisis saw Denmark’s debt rise again, reaching 40.2% in 2009, as the government enacted stimulus measures to support the economy. However, disciplined fiscal management helped reduce the debt ratio through the 2010s, with debt as low as 33.7% in 2019. The COVID-19 pandemic caused a temporary spike in 2020 to 42.2%, but by 2022, Denmark had reduced this to 29.7% amid strong post-pandemic economic recovery and prudent fiscal policies.
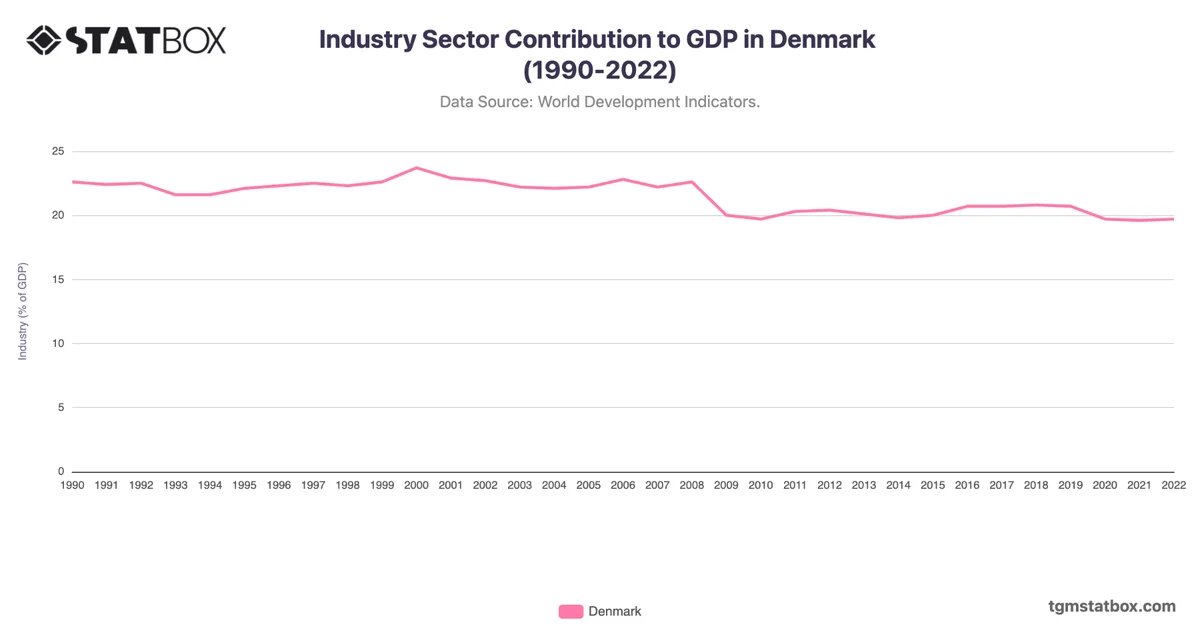
For a broader context, visit other statistics on Denmark’s annual GDP growth, Denmark’s industry sector share of GDP, Denmark’s annual GDP data.