The chart highlights the trends in Ethiopia's working-age population (ages 15 to 64) from 1990 to 2022. In 1990, the working-age population accounted for 50.9% of the total population, but this percentage experienced a slight decline during the early 1990s, reaching 49.8% by 2000. However, from 2002 onward, the trend reversed, and the working-age population began to increase steadily, rising to 57.2% by 2022.
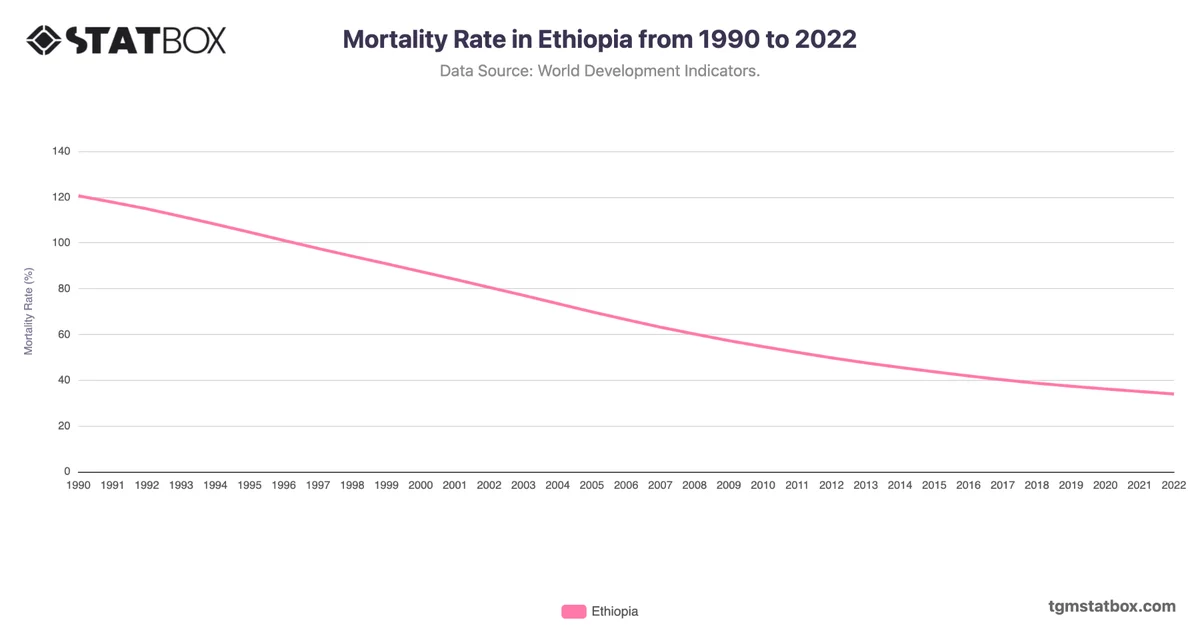
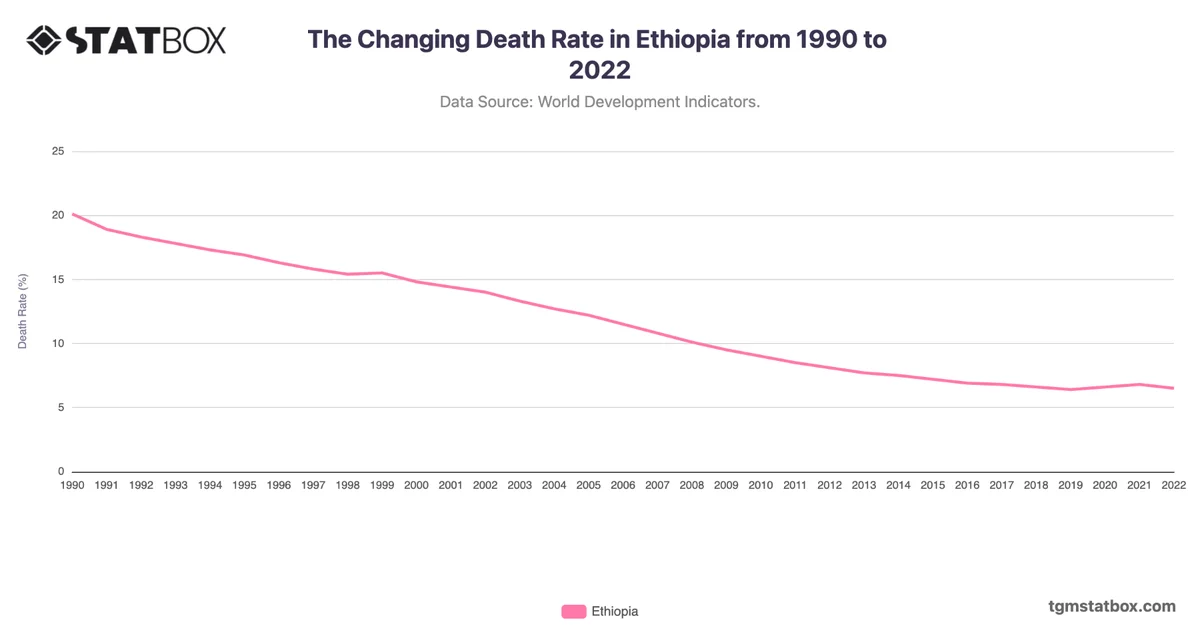
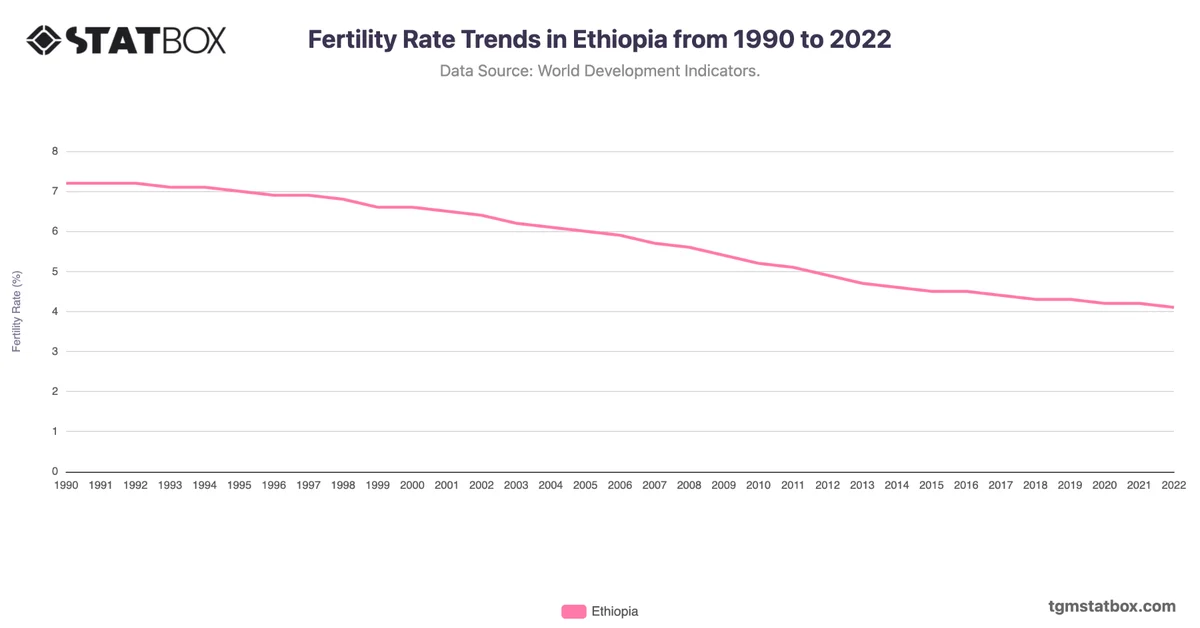
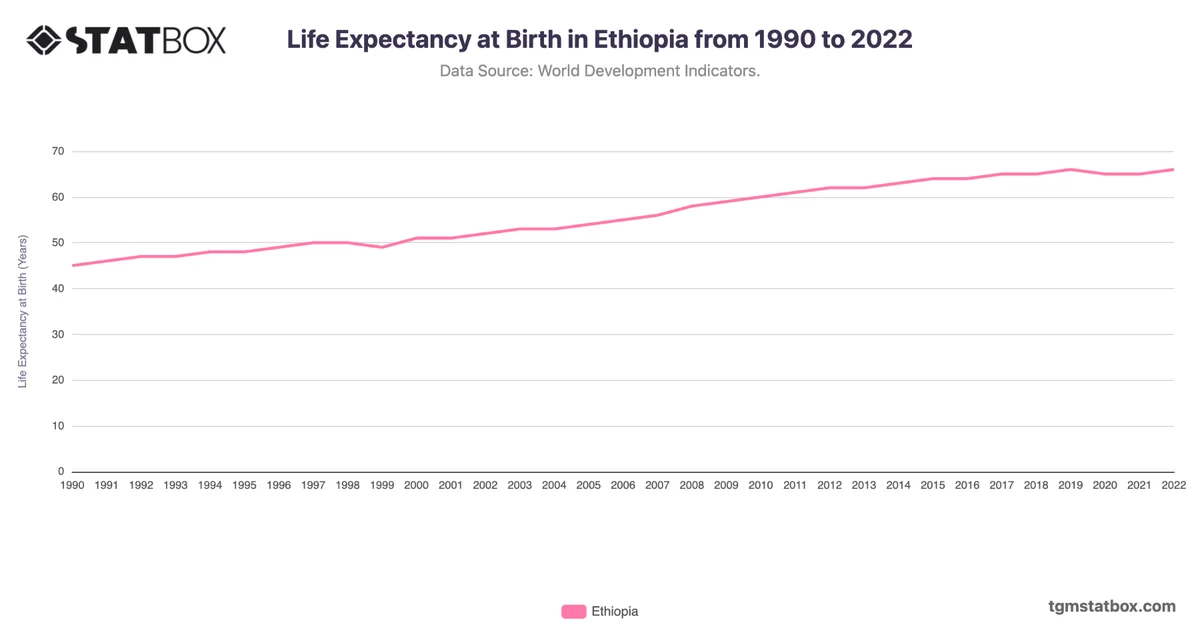
This growth reflects Ethiopia’s demographic transition, driven by improvements in healthcare, increased life expectancy, and declining birth rates. As the working-age population grows, Ethiopia has the potential to harness a demographic dividend, provided that adequate job opportunities and skills development programs are in place. The increasing proportion of the working-age population indicates potential for accelerated economic growth, but it also underscores the need for targeted policies to address unemployment
This growth reflects Ethiopia’s demographic transition, driven by improvements in healthcare, increased life expectancy, and declining birth rates. As the working-age population grows, Ethiopia has the potential to harness a demographic dividend, provided that adequate job opportunities and skills development programs are in place. The increasing proportion of the working-age population indicates potential for accelerated economic growth, but it also underscores the need for targeted policies to address unemployment
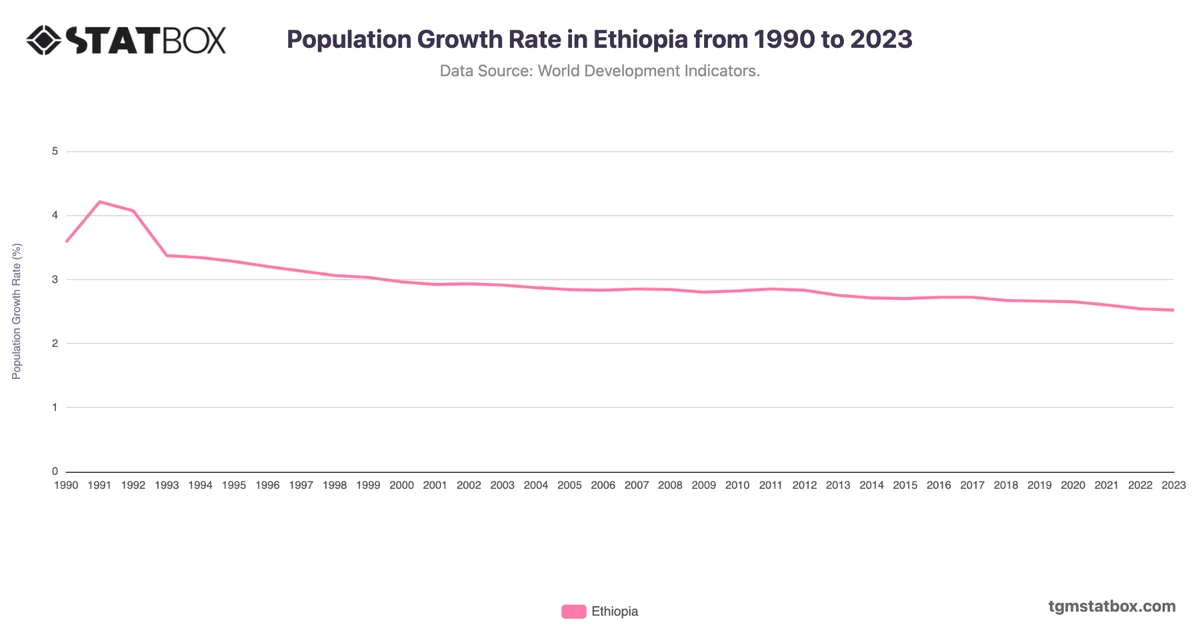
Find out more through related statistics on Ethiopia’s population density, Ethiopia’s unemployment rate trend, Ethiopia’s population growth rate.