Share the statistic on social media channels or embed the statistic in your website using "Embed Code", where available.
Share chart
Embed chart Embed copied!Cite this statistic and select one of the following formats: APA, Chicago, Harvard, MLA & Bluebook
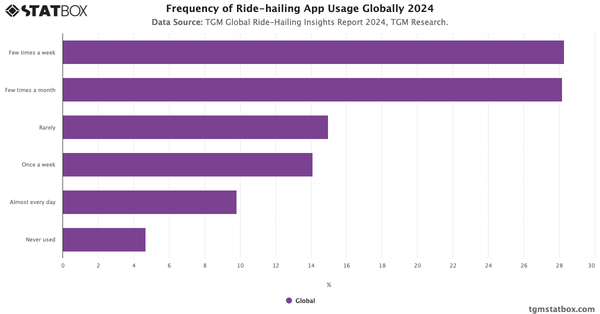
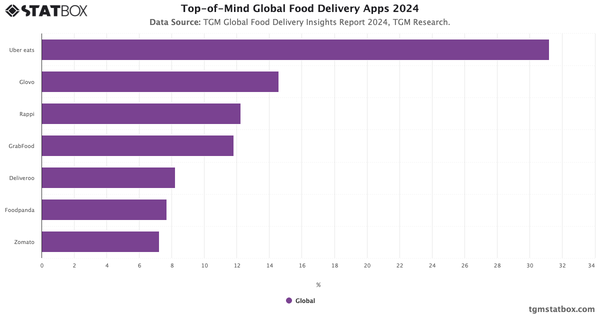
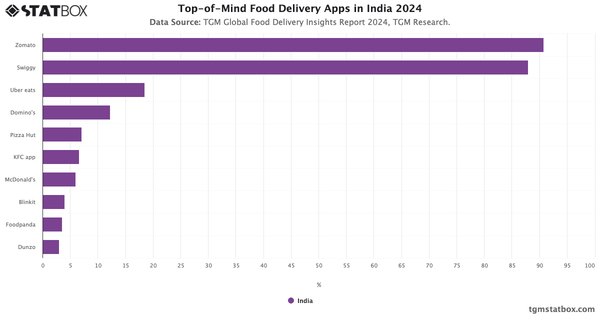
"How often do you use food delivery app?"
Key Takeaways
On a global scale, food delivery apps have become a regular part of everyday life. More than 53.4% of users order at least once a week, and another 34% use them a few times per month. This frequent usage is driven by a variety of motivations. Some people turn to food delivery out of convenience—whether they’re sick, too busy to cook, or simply want to avoid the hassle of meal prep. Others are motivated by the appeal of promotions and discounts, or the desire to explore different cuisines. The ability to order late at night also adds to the convenience. Altogether, this combination of practical benefits and lifestyle-driven habits has made food delivery apps a go-to solution for a wide range of user needs.

Global Food Delivery Insights Report
Learn more about global Food Delivery consumers with TGM StatBox. Explore in-depth insight report, featuring user behavior, trends, and preferences.
Go to report


Connect with our expert team for immediate assistance or comprehensive market analysis. We are always ready to support your business needs.