Share the statistic on social media channels or embed the statistic in your website using "Embed Code", where available.
Share chart
Embed chart Embed copied!Cite this statistic and select one of the following formats: APA, Chicago, Harvard, MLA & Bluebook
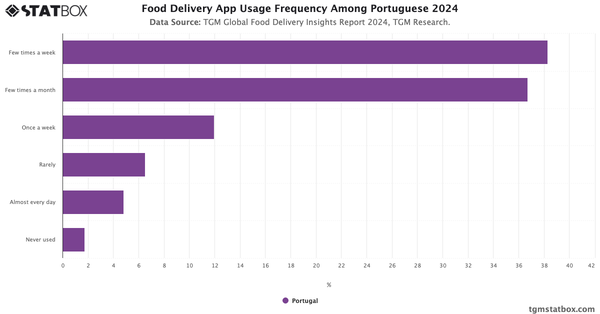
"How often do you use food delivery app?"
Key Takeaways
In LATAM, food delivery app usage is fairly regular, with nearly 53% of respondents using them at least once a week—the most common frequency being a few times a week. Another 36% use these services a few times a month, showing that even those who don’t rely on them weekly still engage with them consistently.

Food Delivery Insights Report in LATAM
Learn more about Food Delivery in LATAM with TGM StatBox. Explore our detailed report, complete with graphs and tables, for in-depth insights.
Go to report


Connect with our expert team for immediate assistance or comprehensive market analysis. We are always ready to support your business needs.