Trends in Working Age Population Percentage in Germany from 1990 to 2022
Germany's working-age population showed a gradual decline from 69% in 1990 to 63.6% in 2022. The decrease can be attributed to an aging population, particularly as the post-war baby boomers aged into retirement. The country’s declining birth rates and changing immigration patterns have further influenced the labor force participation. The steady drop from 2005 onward reflects these demographic challenges, although policies to attract skilled labor and improve retirement age adjustments have somewhat offset this decline.
Germany's working-age population showed a gradual decline from 69% in 1990 to 63.6% in 2022. The decrease can be attributed to an aging population, particularly as the post-war baby boomers aged into retirement. The country’s declining birth rates and changing immigration patterns have further influenced the labor force participation. The steady drop from 2005 onward reflects these demographic challenges, although policies to attract skilled labor and improve retirement age adjustments have somewhat offset this decline.
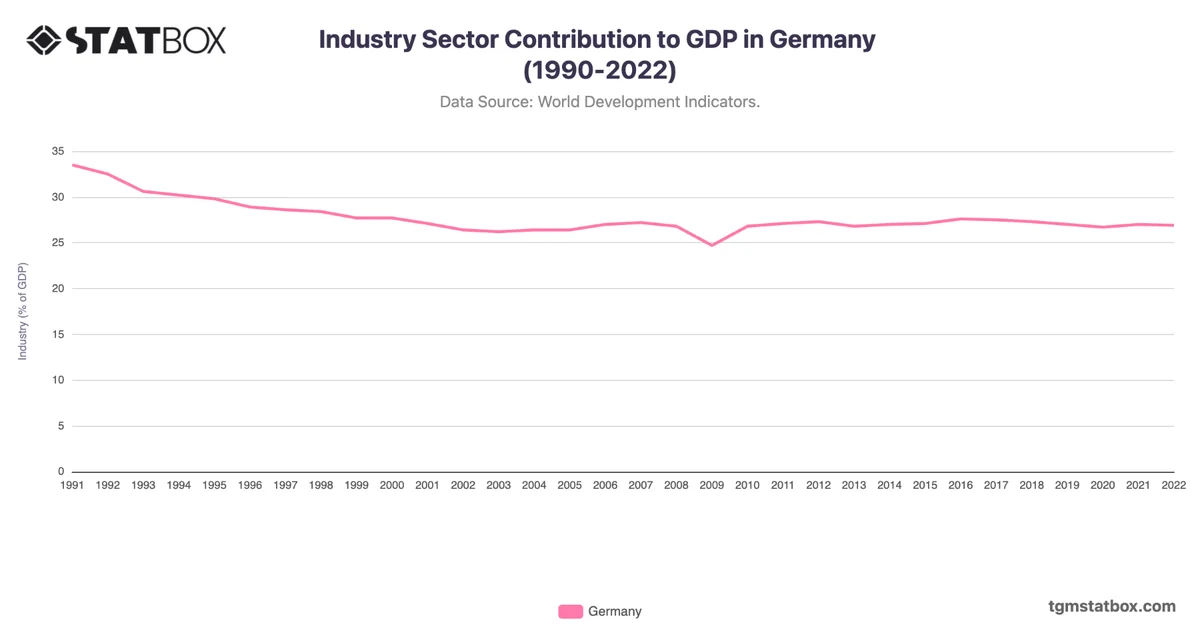
Discover additional trends and data on Germany’s shifting median age, Germany’s industry sector’s GDP contribution, Germany’s population density.