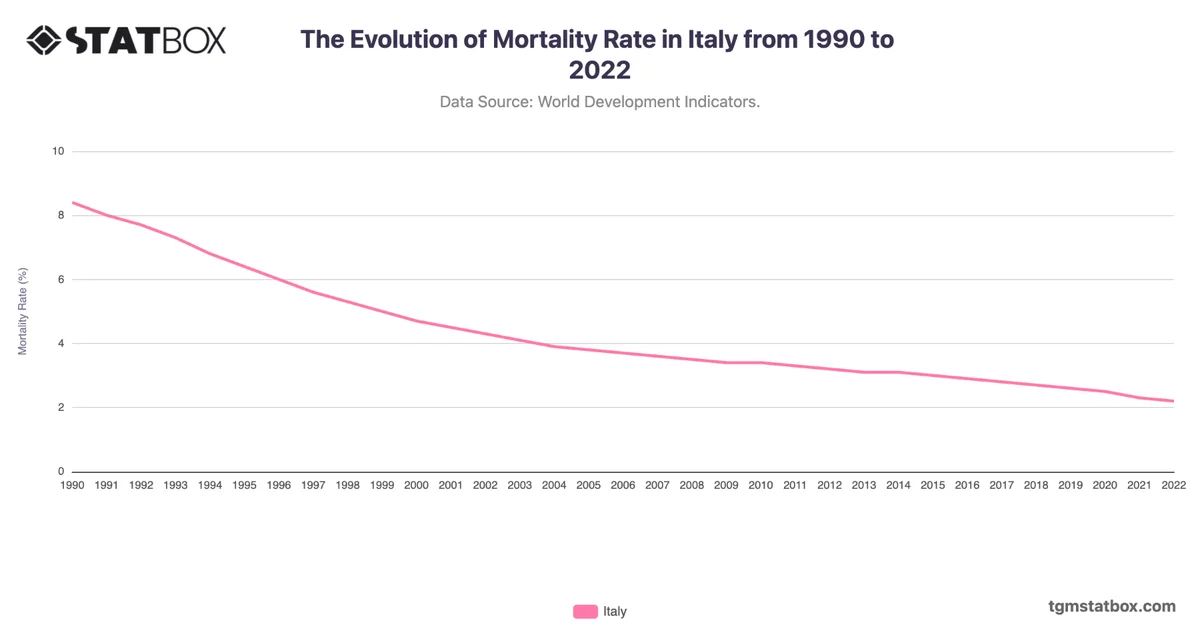
Italy's death rate remained relatively stable from 1990 to the early 2010s, hovering around 9.6 to 10.0, reflecting a well-established healthcare system. However, increases after 2015 correlate with an aging population and seasonal flu impacts.
The sharp spike to 12.5 in 2020 and 11.9 in 2021 directly results from the COVID-19 pandemic, during which Italy was one of the hardest-hit countries in Europe. The slight decline to 12.1 in 2022 reflects recovery efforts but underscores the demographic challenge of an aging society with high mortality risks.
The sharp spike to 12.5 in 2020 and 11.9 in 2021 directly results from the COVID-19 pandemic, during which Italy was one of the hardest-hit countries in Europe. The slight decline to 12.1 in 2022 reflects recovery efforts but underscores the demographic challenge of an aging society with high mortality risks.
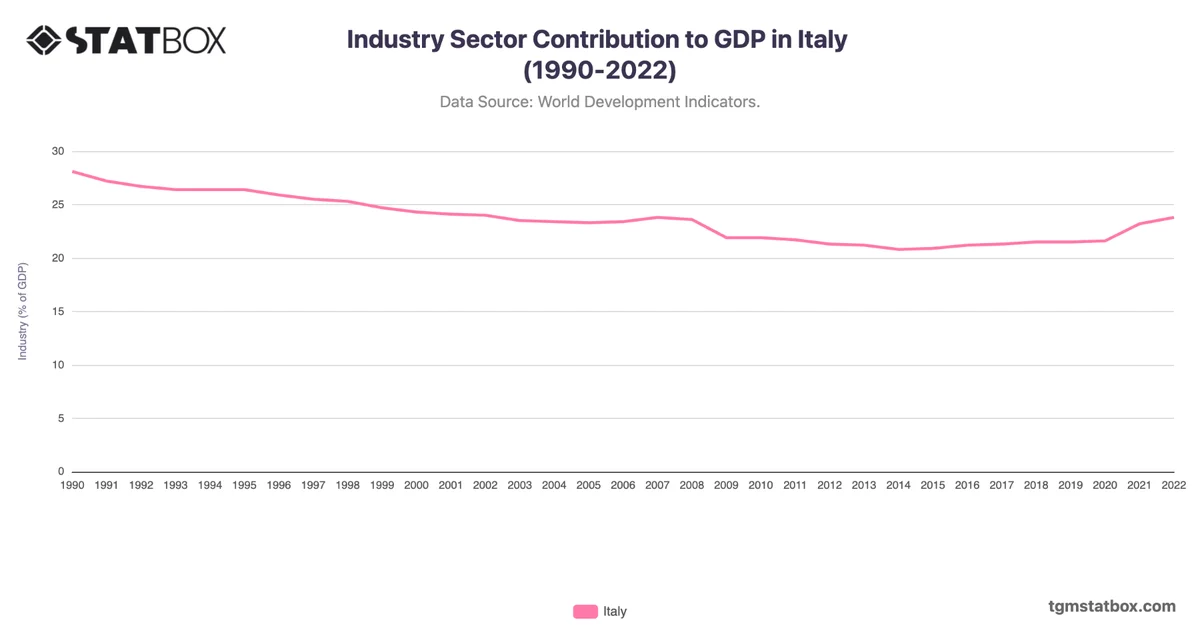
Gain a broader perspective by reviewing Italy’s annual GDP growth rate, Italy’s military personnel proportion, Italy’s industry sector share in GDP.