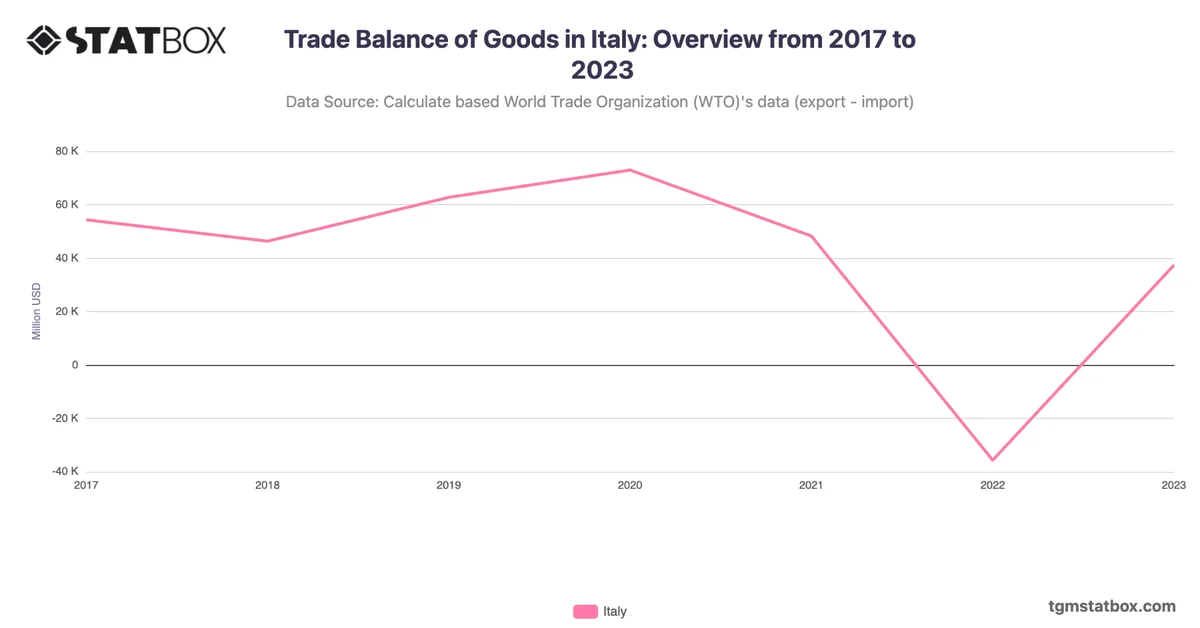
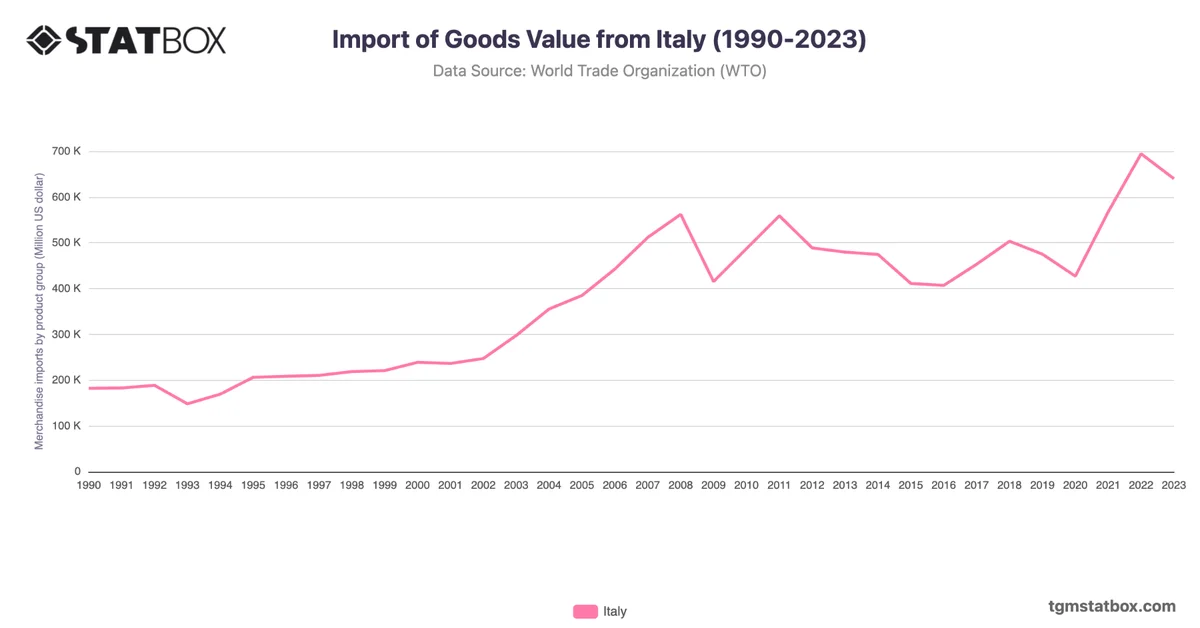
Italy's export value experienced steady growth, rising from $170.3 billion in 1990 to $676.9 billion in 2023. The early 2000s saw significant progress as Italy capitalized on its strengths in luxury goods, automotive, and machinery.
Following a dip during the 2009 global crisis, exports rebounded robustly, reaching a peak in 2022 due to strong demand in European and Asian markets. Italy's consistent performance highlights its diversified export base and adaptability to global trade dynamics.
Following a dip during the 2009 global crisis, exports rebounded robustly, reaching a peak in 2022 due to strong demand in European and Asian markets. Italy's consistent performance highlights its diversified export base and adaptability to global trade dynamics.
Discover additional trends and data on import value from Italy, Italy’s services sector share in GDP, Italy’s military personnel proportion.