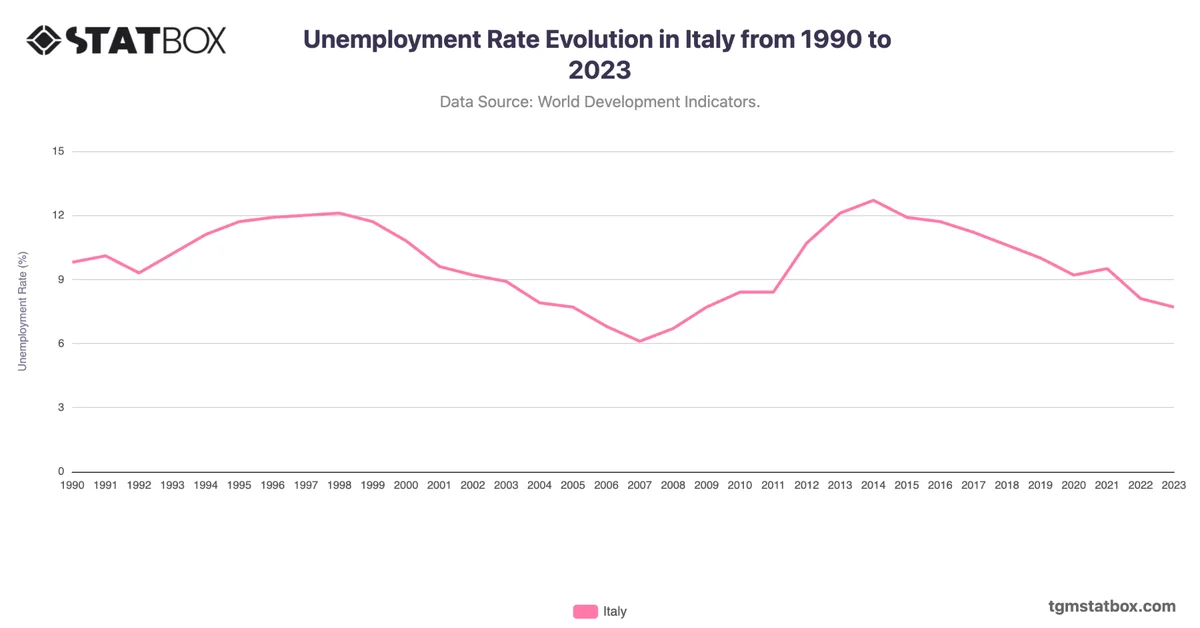
Italy’s fertility rate remained low throughout the observed period, fluctuating between 1.2 and 1.5. The rate reached its lowest point at 1.2 in 1994 and again in 2020, reflecting Italy's status as one of Europe’s lowest-fertility countries. Contributing factors include economic uncertainty, high youth unemployment, and cultural norms favoring smaller families.
Slight increases in the late 2000s were driven by immigration and supportive policies for working families, but these gains were not sustained. By 2022, the fertility rate remained below replacement level, posing challenges for population growth and aging demographics.
Slight increases in the late 2000s were driven by immigration and supportive policies for working families, but these gains were not sustained. By 2022, the fertility rate remained below replacement level, posing challenges for population growth and aging demographics.
For a deeper dive into the topic, explore Italy’s population figures, Italy’s industry sector share in GDP, Italy’s annual GDP growth rate.