Chart

Trends in Working Age Population Percentage in Kenya from 1990 to 2022

Trends in Working Age Population Percentage in Kenya from 1990 to 2022

Share the statistic on social media channels or embed the statistic in your website using "Embed Code", where available.

Share chart

Embed chart
Select Citation

Cite this statistic and select one of the following formats: APA, Chicago, Harvard, MLA & Bluebook


  • APA
  • Chicago
  • Harvard
  • MLA
  • Bluebook
  • IEEE
TGM StatBox. (2024). Trends in Working Age Population Percentage in Kenya from 1990 to 2022. TGM StatBox.
Insights

Key Takeaways

The chart highlights the trends in Kenya’s working-age population (ages 15 to 64) from 1990 to 2022. In 1990, 48.5% of the population was within the working-age group, and this percentage gradually increased over the years, reaching 59.3% by 2022. This trend indicates a shift in Kenya’s population structure toward a greater focus on productivity, reflecting an evolving demographic profile with implications for long-term development and workforce engagement.

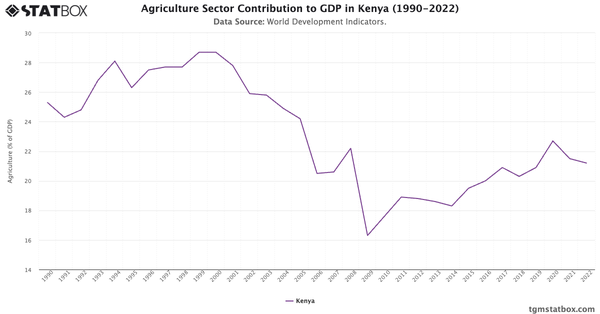
Gain a broader perspective by reviewing Kenya’s agricultural share in GDP, Kenya’s military personnel proportion, Industry sector’s share in Kenya’s GDP.


AI-powered chart insight: This summary is automatically generated to help you understand the chart at a glance. It is intended as an overview; view the full chart and underlying data for complete context.

Charts library

Further Recommended Kenya Statistics

Statbox vector
The briefing
New data, in your inbox

Consumer insights, data stories and product updates as we publish them. No other mail, and one click to leave.

Roughly two emails a month.

Research services
Have a question our newsroom hasn't answered? Ask it directly.

Our team can run the study behind the story — in 60+ countries, on your question, with the data belonging to you.