Kenya’s import values have steadily risen, increasing from $2.2B in 1990 to $21.2B in 2022. Growth was notable in the early 2000s, as imports nearly tripled from $4.6B in 2004 to $11.1B in 2008, supported by economic reforms and infrastructure projects.
Following a dip during the global financial crisis, imports resumed growth, peaking at $21.2B in 2022. The 2023 decline to $18.6B reflects adjustments due to global economic pressures. Kenya’s reliance on industrial goods and energy imports highlights its growing but import-dependent economy.
Following a dip during the global financial crisis, imports resumed growth, peaking at $21.2B in 2022. The 2023 decline to $18.6B reflects adjustments due to global economic pressures. Kenya’s reliance on industrial goods and energy imports highlights its growing but import-dependent economy.
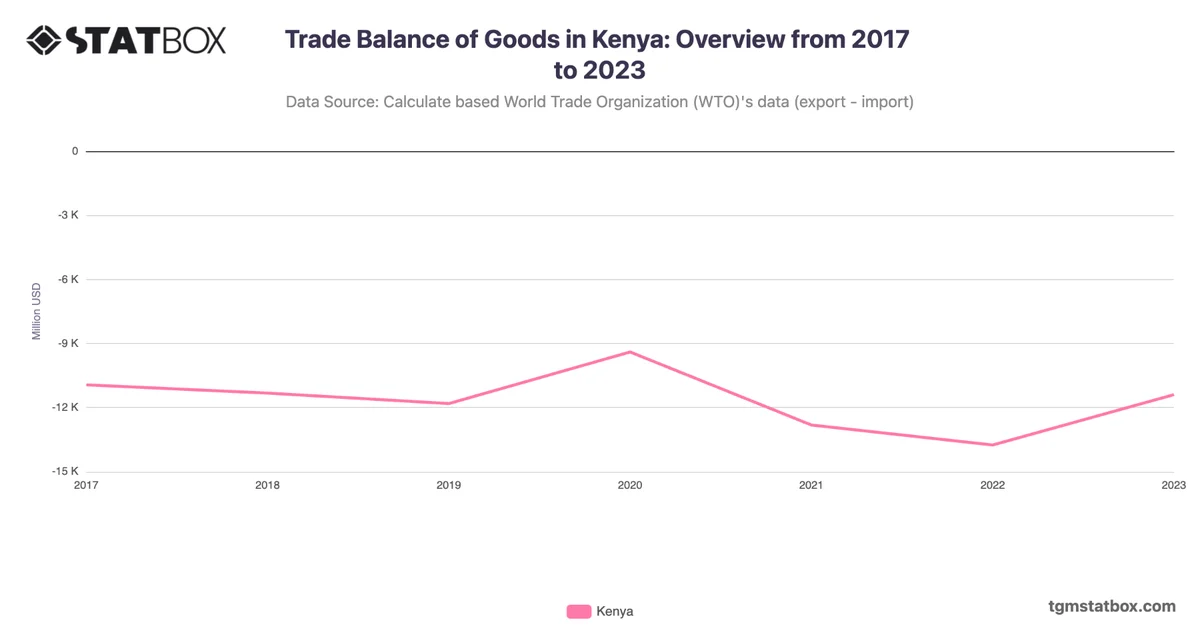
For a deeper dive into the topic, explore Kenya’s agricultural share in GDP, Kenya’s goods trade balance, Kenya’s population figures.