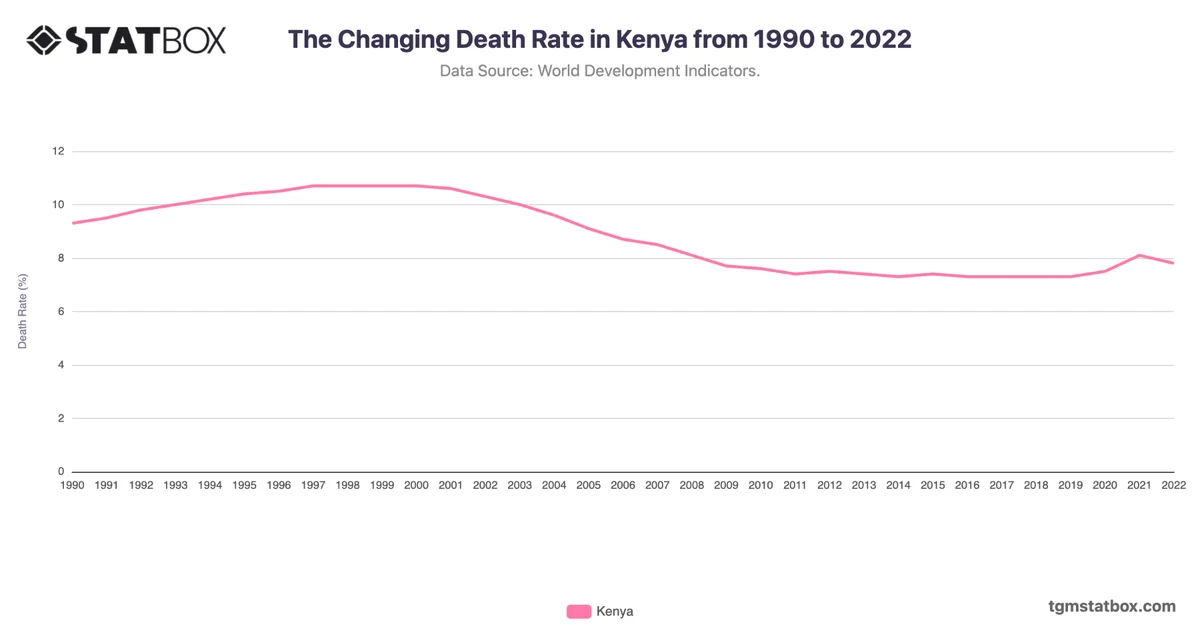
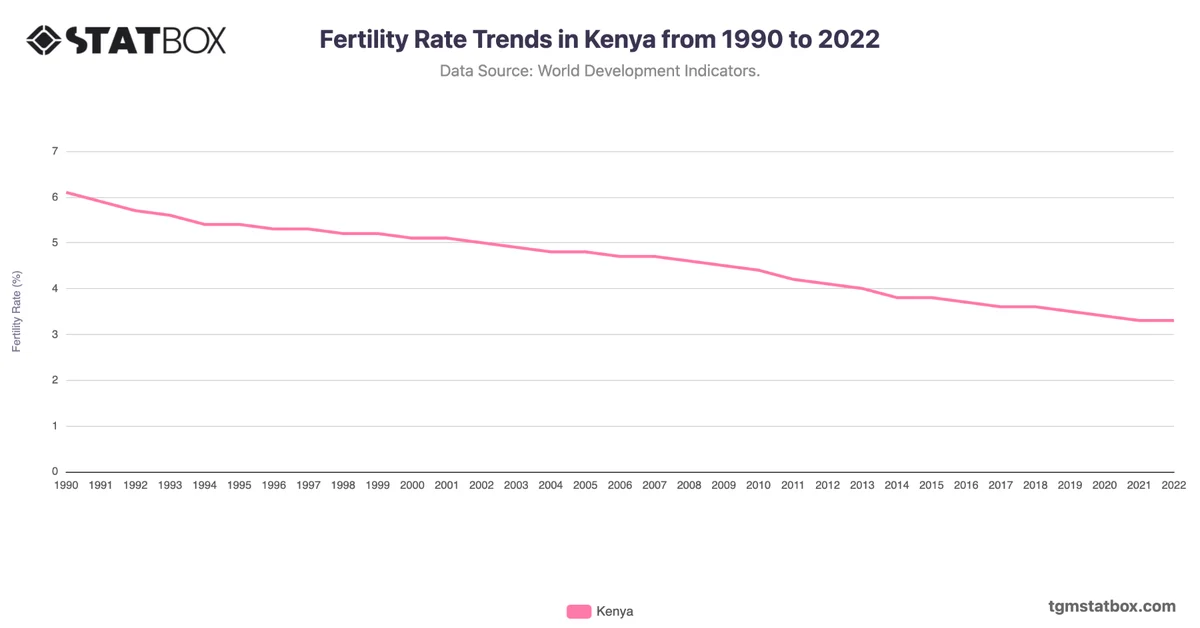
Kenya’s mortality rate experienced a gradual decline from 64.4 in 1990 to 30.5 in 2022. The 1990s were marked by a plateau, with a peak of 67.1 in 1993, attributed to the HIV/AIDS epidemic and limited healthcare infrastructure. By 2000, the rate had decreased to 58.2, as international aid programs and public health campaigns began to take effect.
From 2000 onward, the decline accelerated, reaching 36.9 by 2010, driven by improvements in access to antiretroviral therapy, expanded immunization coverage, and maternal health initiatives. By 2022, the rate had dropped to 30.5, though challenges such as regional disparities in healthcare access persist.
From 2000 onward, the decline accelerated, reaching 36.9 by 2010, driven by improvements in access to antiretroviral therapy, expanded immunization coverage, and maternal health initiatives. By 2022, the rate had dropped to 30.5, though challenges such as regional disparities in healthcare access persist.
Gain a broader perspective by reviewing Kenya’s services sector GDP share, Kenya’s unemployment rate, Kenya’s birth longevity rate.