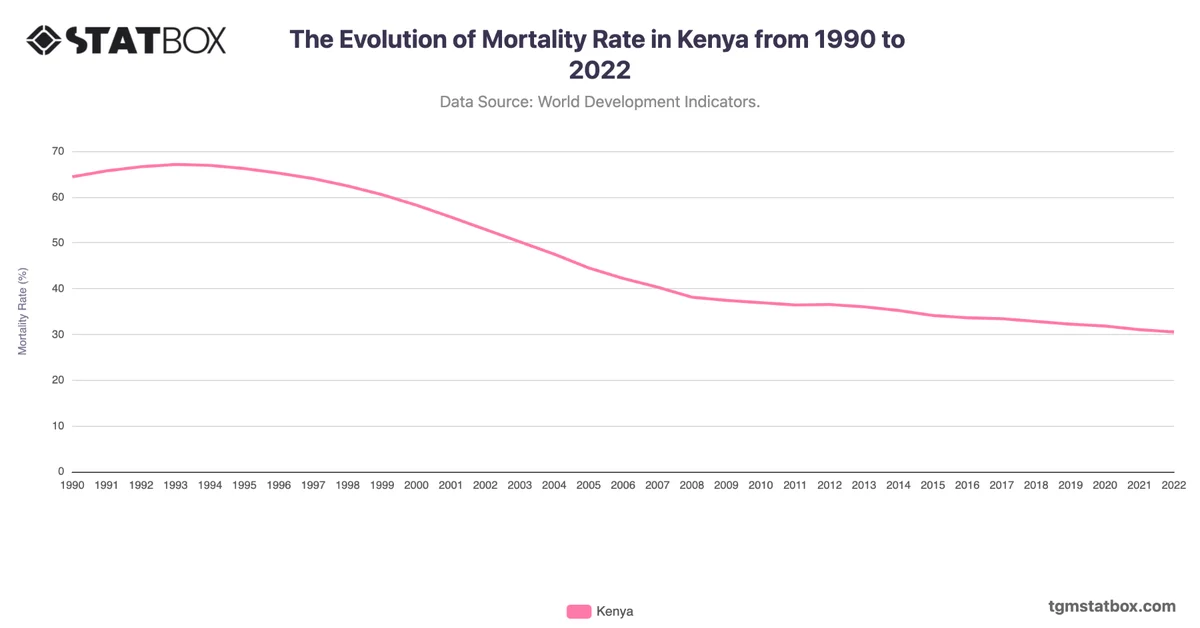
Kenya's death rate peaked at 10.7 in the late 1990s and declined to 7.3 by 2019 due to improvements in healthcare, sanitation, and disease prevention programs. Early peaks were heavily influenced by the HIV/AIDS epidemic, which severely affected Sub-Saharan Africa. Interventions, including antiretroviral treatments and public health campaigns, led to a steady decline from the 2000s onwards.
The slight rise to 8.1 in 2021 corresponds to the COVID-19 pandemic, which strained healthcare infrastructure and increased mortality. The subsequent drop to 7.8 in 2022 suggests recovery efforts are underway, though Kenya still faces challenges in addressing healthcare disparities.
The slight rise to 8.1 in 2021 corresponds to the COVID-19 pandemic, which strained healthcare infrastructure and increased mortality. The subsequent drop to 7.8 in 2022 suggests recovery efforts are underway, though Kenya still faces challenges in addressing healthcare disparities.
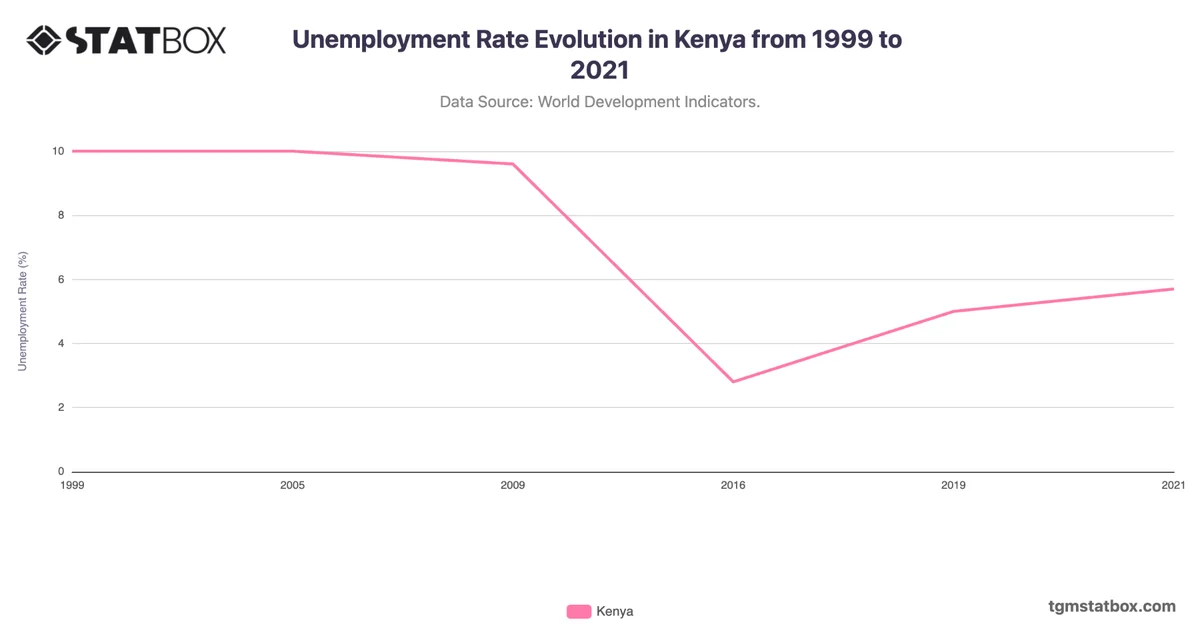
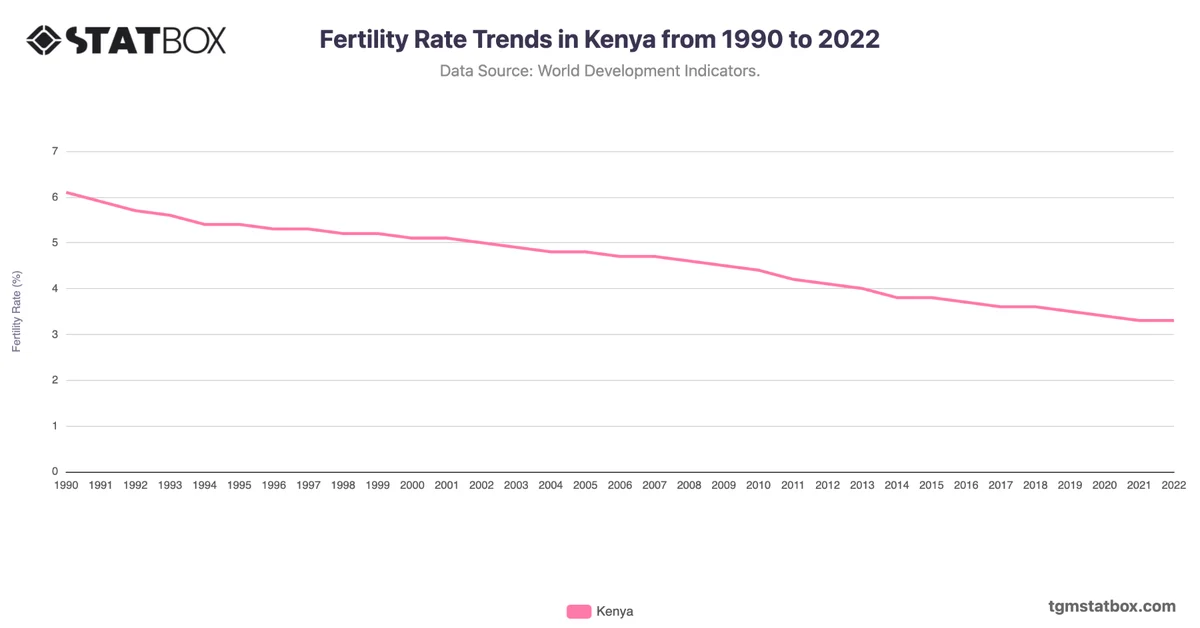
Gain a broader perspective by reviewing Kenya’s fertility rate, Kenya’s birth longevity rate, Kenya’s unemployment rate.