Mexico’s GDP showcases steady growth, supported by oil revenues, trade agreements, and diversification. From $14.1 billion in 1961, GDP rose to $205 billion in 1980, driven by an oil boom. However, the 1982 debt crisis caused a contraction, with GDP falling to $134 billion by 1986.
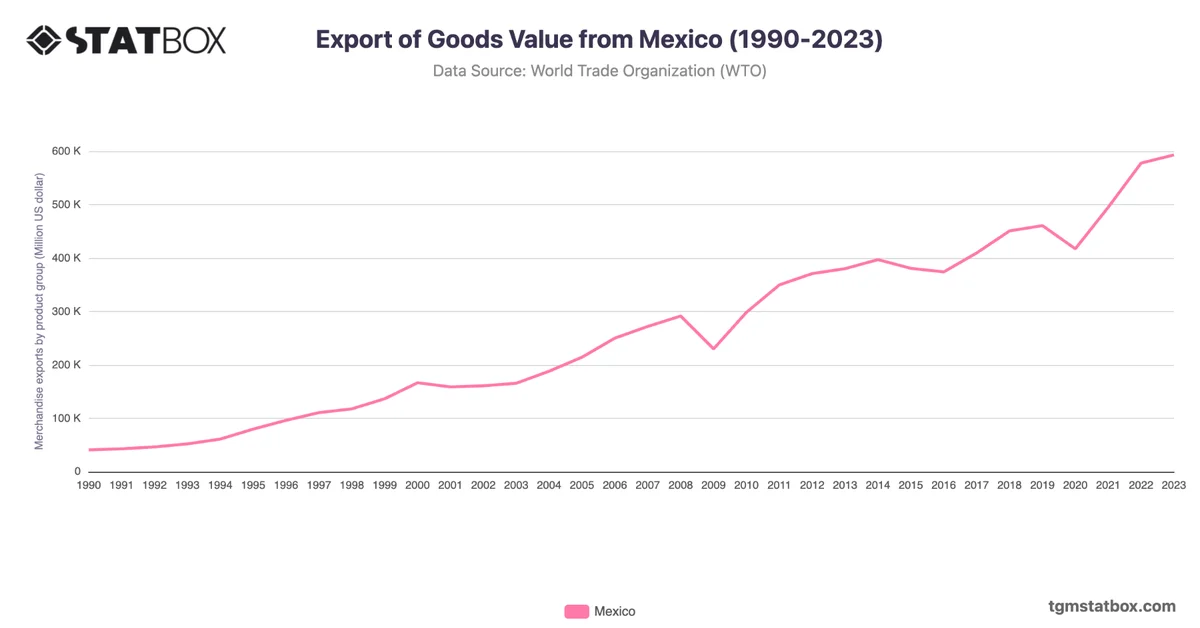
NAFTA's implementation in 1994 accelerated growth, with GDP reaching $742 billion by 2000. Despite setbacks during the 2008 financial crisis, GDP rebounded, hitting $1.78 trillion in 2023, supported by exports, manufacturing, and trade integration with the United States and Canada.
NAFTA's implementation in 1994 accelerated growth, with GDP reaching $742 billion by 2000. Despite setbacks during the 2008 financial crisis, GDP rebounded, hitting $1.78 trillion in 2023, supported by exports, manufacturing, and trade integration with the United States and Canada.
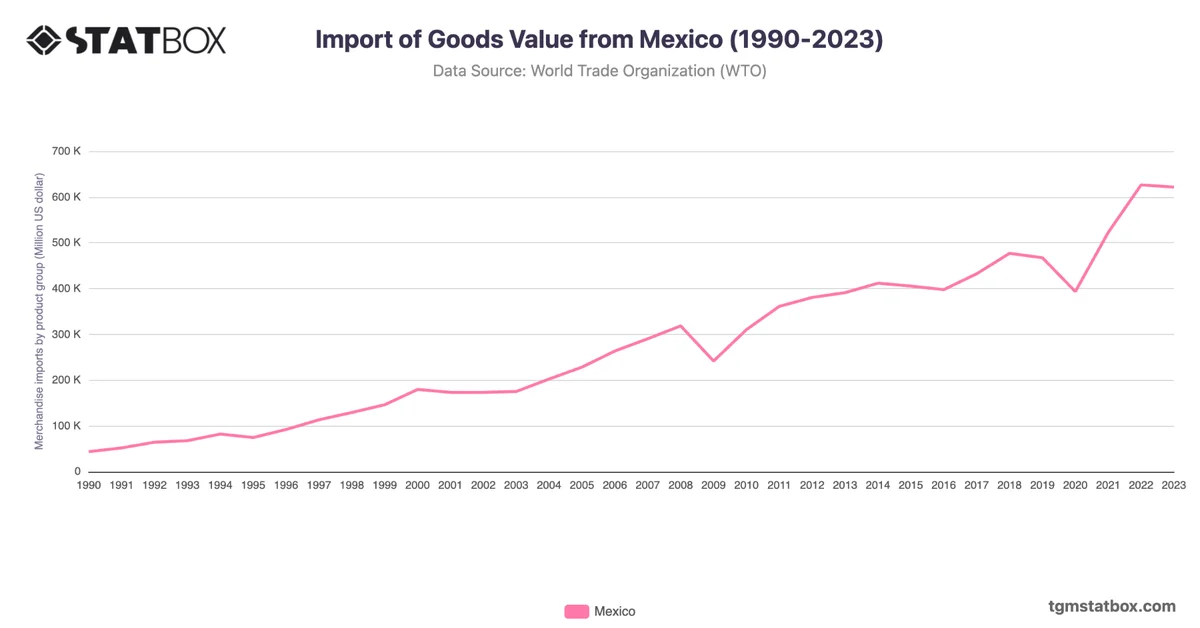
Explore related charts to gain a better understanding of value of goods imported from Mexico, Mexico’s annual GDP growth rate, Mexico’s population totals.