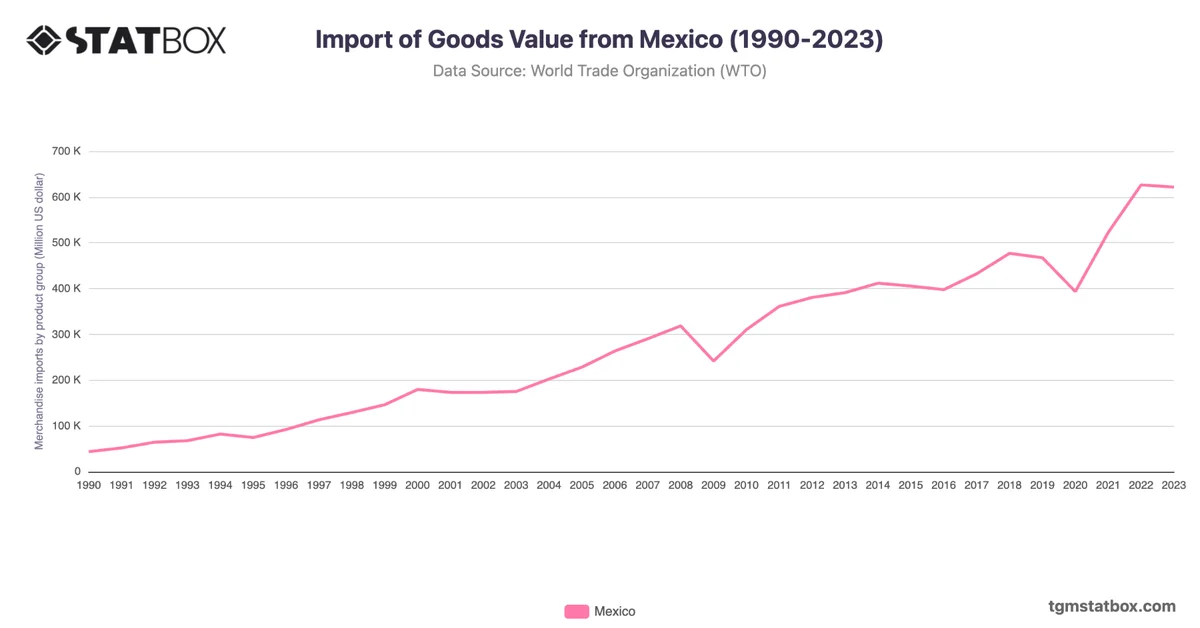
Mexico's export growth since 1990 illustrates its transformation into a manufacturing hub. Exports rose from USD 40 billion in 1990 to over USD 166 billion in 2000, bolstered by the implementation of NAFTA in 1994. The agreement facilitated growth in automotive, electronics, and agricultural exports.
Despite setbacks during the 2008 financial crisis, exports soared to USD 577 billion by 2022, reflecting Mexico's strengthened ties with the U.S. and its role in global supply chains. The recent uptick in nearshoring trends and trade diversification continues to position Mexico as a critical exporter in the Americas.
Despite setbacks during the 2008 financial crisis, exports soared to USD 577 billion by 2022, reflecting Mexico's strengthened ties with the U.S. and its role in global supply chains. The recent uptick in nearshoring trends and trade diversification continues to position Mexico as a critical exporter in the Americas.
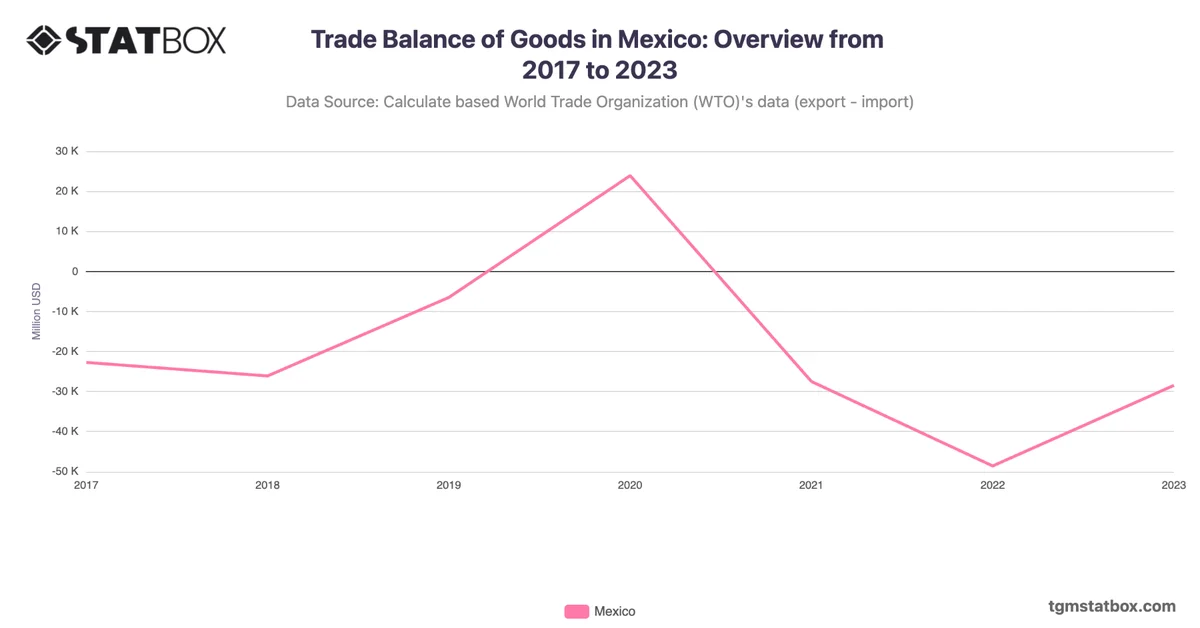
For additional information, visit statistics on Mexico’s goods trade balance, Mexico’s annual GDP figures, Mexico’s annual GDP growth rate.