Mexico's industry sector contribution to GDP showed notable volatility from 1990 through 2022, with highs and lows influenced by both domestic policies and international trade dynamics. From 26.1% in 1990, the sector surged to a peak of 34.8% in 1997, spurred by the North American Free Trade Agreement (NAFTA), which significantly boosted Mexico’s manufacturing and export industries. A consistent share around 33-34% persisted into the early 2000s, reflecting strong performance in automobile and electronics manufacturing.
However, the global financial crisis in 2008 led to a contraction, with the contribution dropping to 32% in 2009. The 2010s saw some stabilization around 31-32%, though industrial challenges, including declining oil production and increased competition, impacted the growth trajectory. In recent years, the industrial sector has rebounded, with a 2022 figure of 33.6%, driven by nearshoring trends and investments in manufacturing, which have strengthened Mexico's industrial base as a key player in North American supply chains.
However, the global financial crisis in 2008 led to a contraction, with the contribution dropping to 32% in 2009. The 2010s saw some stabilization around 31-32%, though industrial challenges, including declining oil production and increased competition, impacted the growth trajectory. In recent years, the industrial sector has rebounded, with a 2022 figure of 33.6%, driven by nearshoring trends and investments in manufacturing, which have strengthened Mexico's industrial base as a key player in North American supply chains.
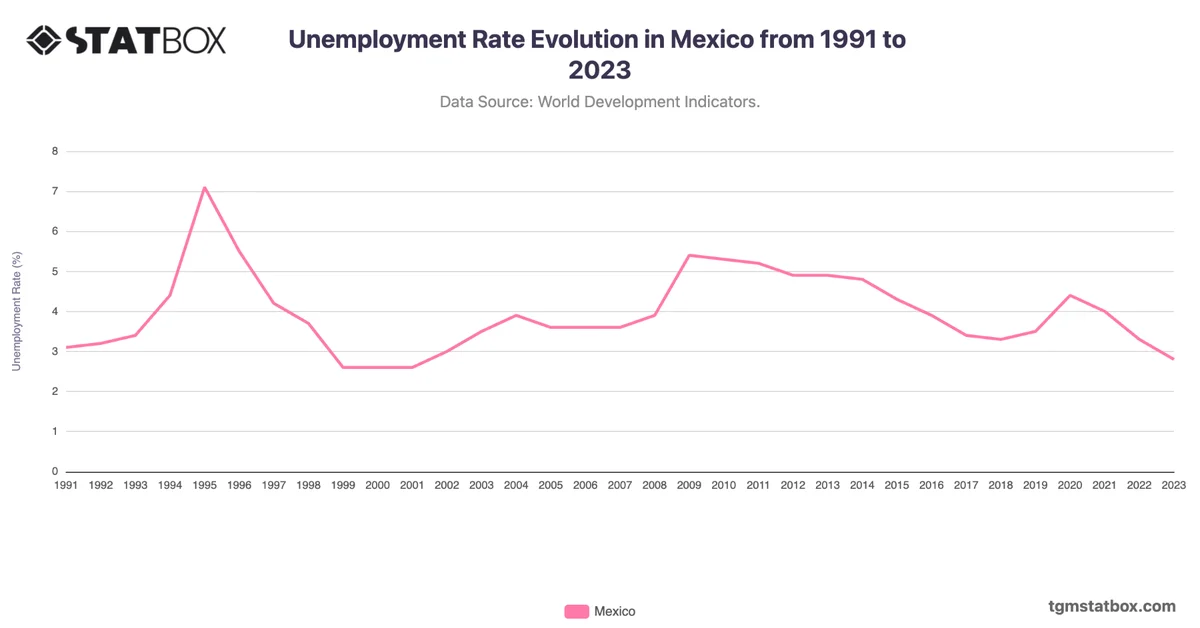
Gain a broader perspective by reviewing Mexico’s population density, Mexico’s services sector share in GDP, Mexico’s unemployment rate trends.