New Zealand's population growth rates showed variability over the decades, reflecting shifts in migration policies and economic conditions. The early 1990s saw moderate growth, peaking at 1.6% in 1996, driven by strong immigration flows. However, the late 1990s marked a slowdown, with rates declining to 0.5% by 1999, as the country faced economic challenges.
The early 2000s witnessed a rebound, highlighted by a significant spike of 2.0% in 2003, due to favorable migration policies. Growth remained robust through the 2010s, with peaks like 2.2% in 2016, reflecting sustained immigration and natural increases. A sharp dip in 2021 (0.4%) and 2022 (0.1%) can be attributed to pandemic-related border closures. However, the growth rate bounced back to 2.0% in 2023 as international migration resumed.
The early 2000s witnessed a rebound, highlighted by a significant spike of 2.0% in 2003, due to favorable migration policies. Growth remained robust through the 2010s, with peaks like 2.2% in 2016, reflecting sustained immigration and natural increases. A sharp dip in 2021 (0.4%) and 2022 (0.1%) can be attributed to pandemic-related border closures. However, the growth rate bounced back to 2.0% in 2023 as international migration resumed.
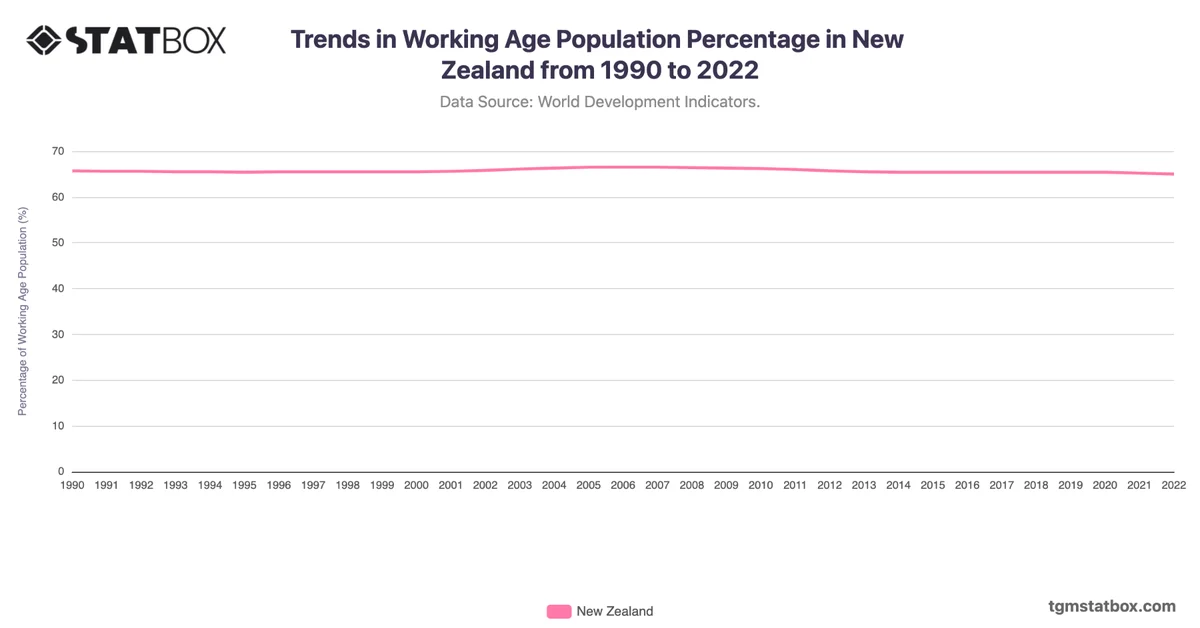
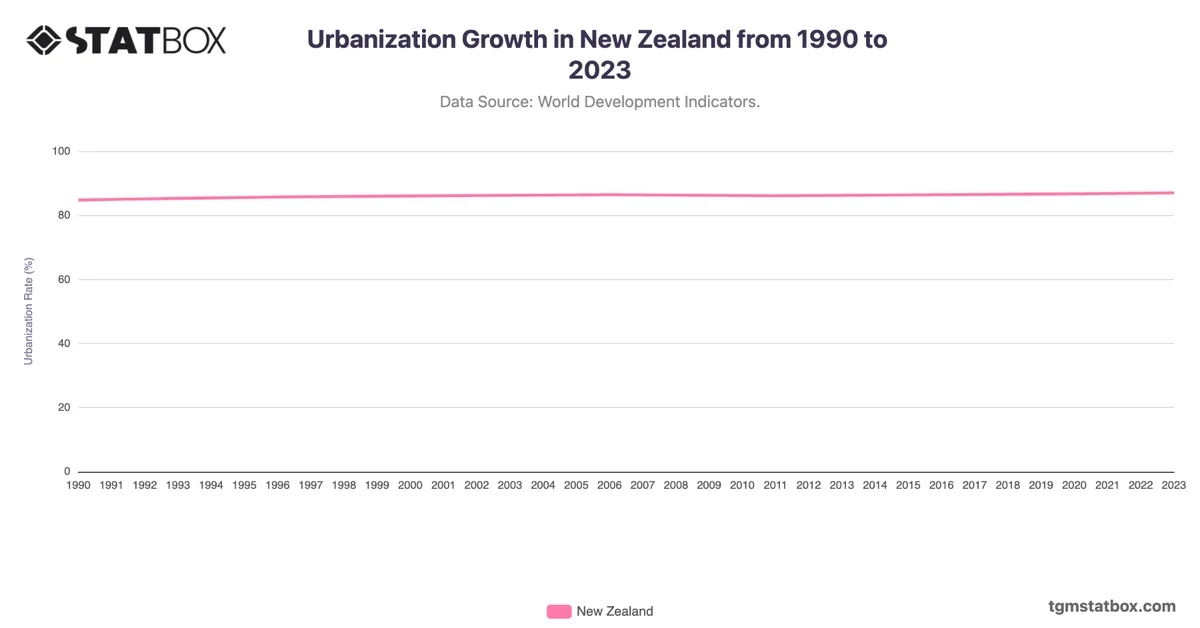
Discover additional trends and data on New Zealand’s working age population ratio, New Zealand’s population density, growth of urbanization in New Zealand.