Nigeria's GDP growth has seen considerable fluctuations since 1961, shaped by periods of boom and recession tied to its dependence on oil, policy changes, and global economic conditions. In the 1970s, the country experienced high growth, with rates peaking at 25% in 1970 due to the oil boom. However, this was followed by instability, including a significant contraction of -13.1% in 1981, largely driven by declining oil prices and political turbulence.
In the early 2000s, Nigeria's economy benefited from rising oil prices and economic reforms, resulting in steady growth rates. The economy diversified slightly during this period, with sectors like telecommunications and agriculture contributing to growth. However, oil remained the dominant driver.
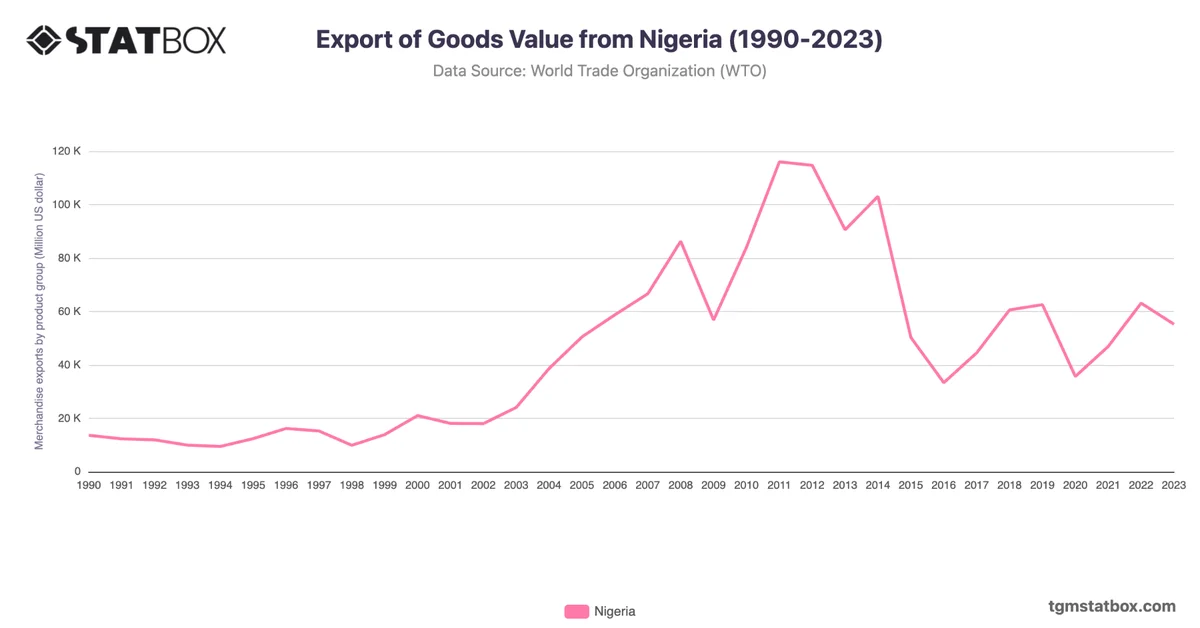
The sharp drop in global oil prices in 2016 led to another contraction, with a GDP decline of -1.6%, highlighting the economy's vulnerability to external shocks. Although the economy began to recover, the COVID-19 pandemic in 2020 caused another contraction of -1.8%. Since then, the economy has gradually recovered, with growth rates improving to around 3.6% in 2021 as oil prices stabilized and non-oil sectors like technology and services expanded.
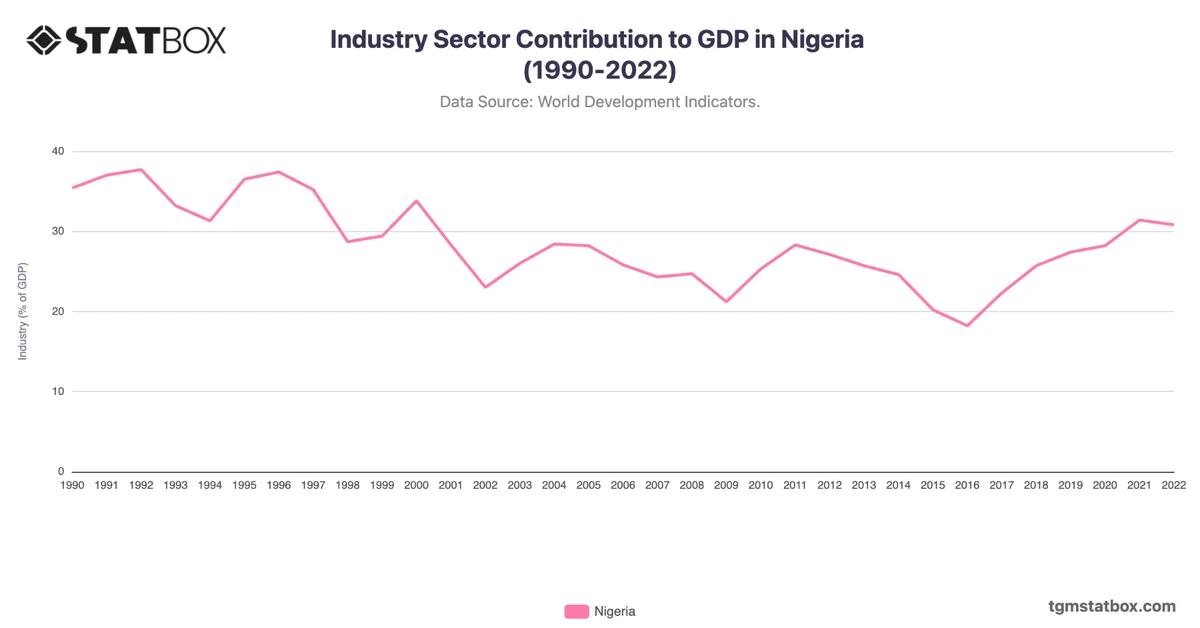
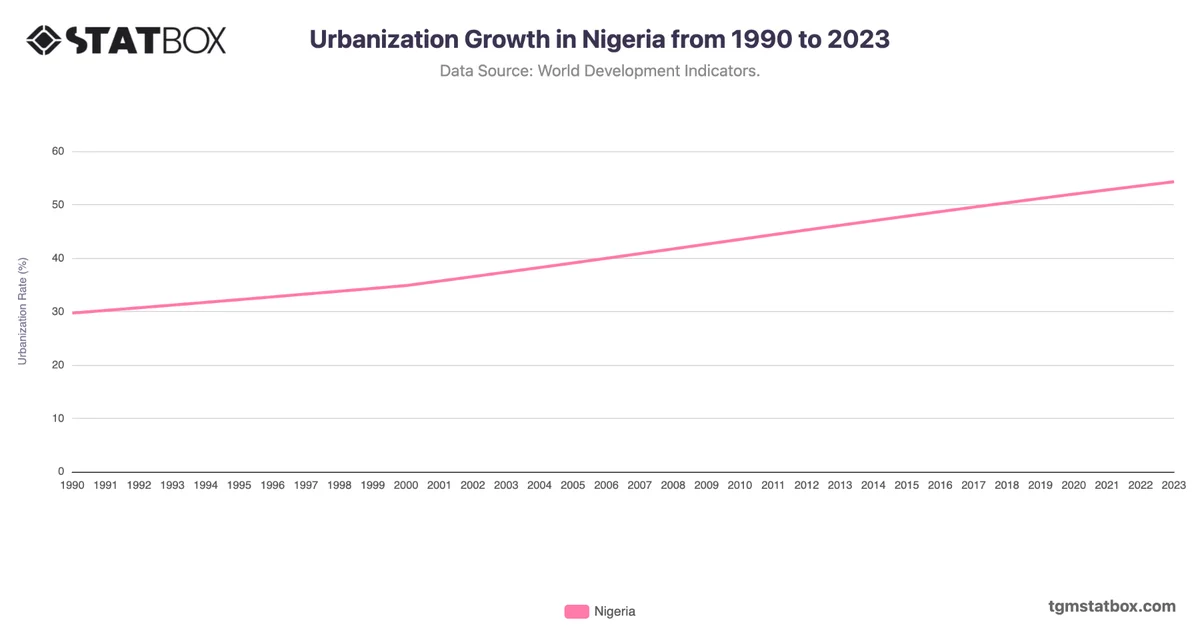
Gain a broader perspective by reviewing Nigeria’s industry sector GDP contribution, Nigeria’s population growth rate, Nigeria’s urbanization growth.