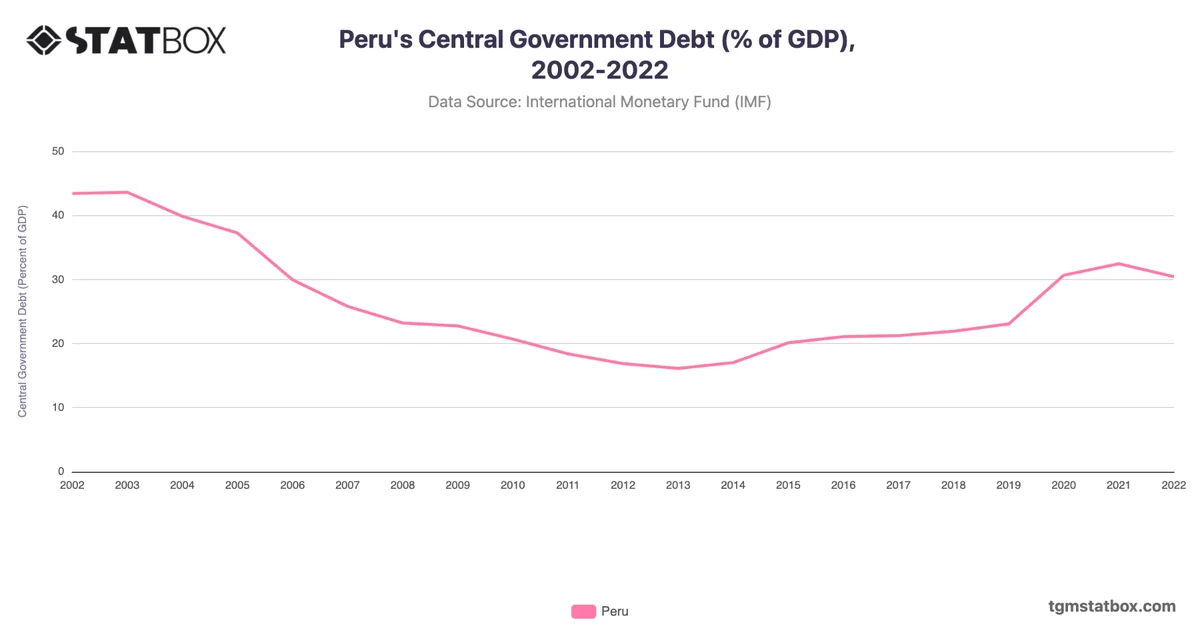
Peru experienced notable reductions in its debt-to-GDP ratio from 1999 to 2014, beginning at 51.5% in 1999 and declining to 19.3% by 2014. This decrease was due to sustained economic growth and effective debt management strategies, including policies aimed at reducing external vulnerabilities and increasing fiscal discipline. In 2008, Peru's debt-to-GDP ratio hit a low of 26.5%, partly as a result of prudent fiscal policies that aligned with robust commodity prices.
From 2015 onward, the debt ratio began to rise modestly, reaching 23.6% in 2018 as Peru increased public investment to support social programs. The COVID-19 pandemic caused a sharp rise, pushing debt to 32.4% in 2020 as the government implemented relief measures to support the economy. By 2022, Peru’s debt ratio had slightly decreased to 31.5%, signaling a cautious return to pre-pandemic fiscal strategies.
From 2015 onward, the debt ratio began to rise modestly, reaching 23.6% in 2018 as Peru increased public investment to support social programs. The COVID-19 pandemic caused a sharp rise, pushing debt to 32.4% in 2020 as the government implemented relief measures to support the economy. By 2022, Peru’s debt ratio had slightly decreased to 31.5%, signaling a cautious return to pre-pandemic fiscal strategies.
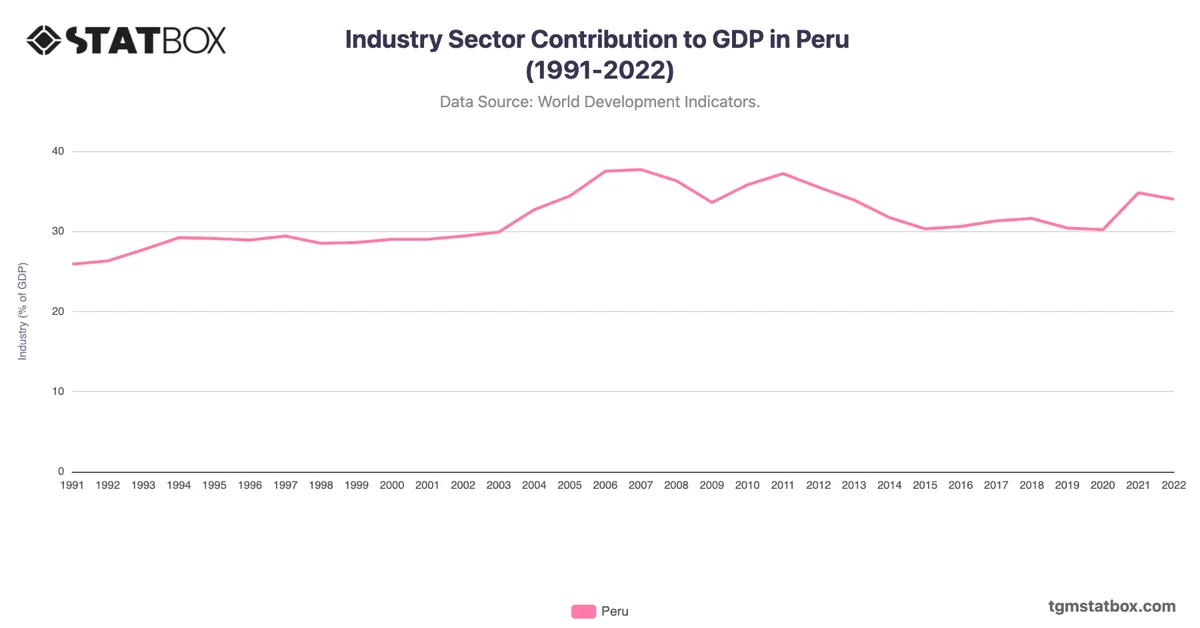
For additional information, visit statistics on industry’s share in Peru’s GDP, Fluctuating mortality rate in Peru, Peru’s GDP % net lending/borrowing.