Gender Alignment in Pet Ownership Attitudes Across Asia Pacific
Attitudes toward pet ownership are shaped by a complex interplay of lifestyle circumstances, living arrangements, and personal preferences. Across Asia Pacific, where urban density and household dynamics vary considerably, the degree to which affection for animals translates into actual ownership is far from straightforward.
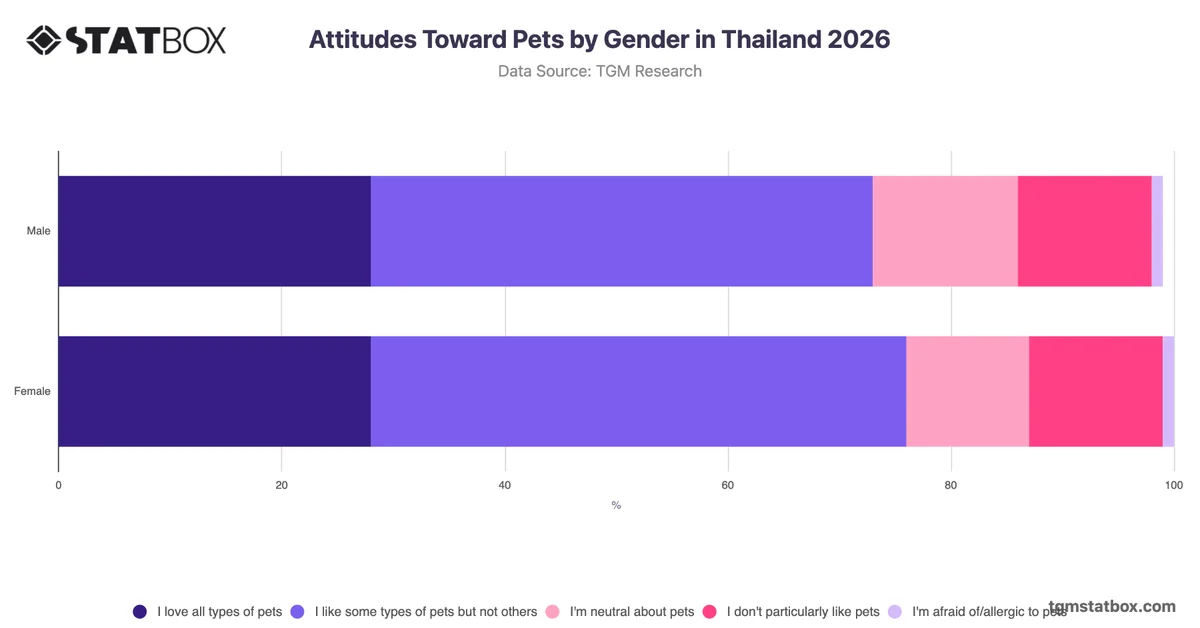
The most notable pattern across the gender breakdown is the strong consistency between male and female respondents, with minimal differentiation across almost every response category. The largest single group in both cases comprises those who express genuine affection for pets but cite practical barriers to ownership, at 32% among males and 33% among females. This points to a market where latent demand is substantial but constrained by circumstance rather than indifference. Negative sentiment, including dislike or fear, remains a minor segment for both genders, each below 20% combined. The close alignment between male and female attitudes suggests that gender is a weak segmentation variable for pet-related communications across Asia Pacific. Organisations developing pet adoption programmes, product messaging, or ownership support services may find greater strategic value in segmenting by household type or life stage rather than gender.