Gender Differentiation in Pet Ownership Across China
Pet ownership sits at the intersection of lifestyle choices, household economics, and personal values. In China, decisions around keeping animals as companions are shaped by factors including living arrangements, disposable income, and attitudes toward companionship and care. Understanding how these decisions vary across demographic lines is relevant for consumer goods producers, veterinary service providers, and retailers operating in the companion animal space.
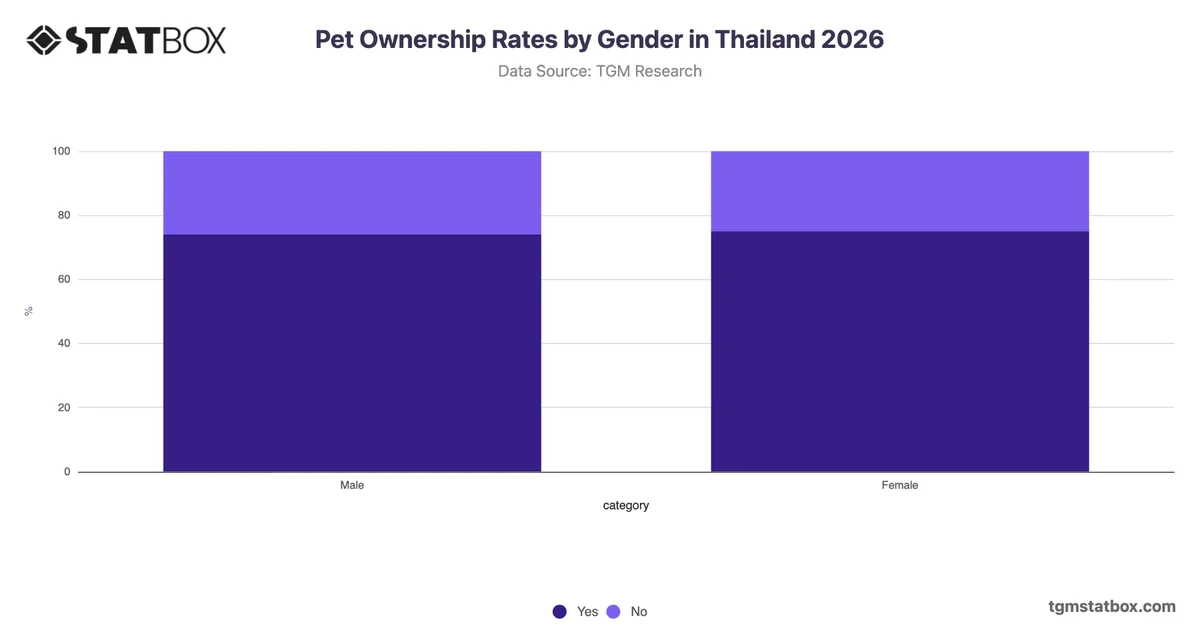
The most notable pattern in the data is a moderate but consistent gender gap in pet ownership rates. Female respondents report ownership at 59%, compared with 53% among male respondents, a six-percentage-point difference that points to a meaningful, if not dramatic, divergence in behaviour. Crucially, majority ownership is recorded across both groups, indicating broad acceptance of pet keeping rather than a niche or gender-specific practice. The gap suggests that while pet ownership is widely distributed, female consumers may represent a slightly more engaged segment. For organisations planning product positioning or audience segmentation, this pattern indicates that gender-neutral strategies remain broadly viable, but targeted communication toward female pet owners may warrant testing to determine whether the ownership gap also corresponds to differences in spending behaviour or category engagement.