Poland's central government debt experienced notable shifts between 1990 and 2022. Debt rose significantly during the early 1990s, peaking at 60.34% in 1994 due to economic restructuring after transitioning from a planned economy. A steady decline followed, with debt reaching 32.88% in 2001, reflecting fiscal reforms and EU accession preparation.
From 2009, debt increased again due to the global financial crisis, reaching 51.41% in 2013. Poland managed to reduce debt levels to 42.53% by 2019. However, the pandemic pushed debt to 46.95% in 2020 before declining to 40.37% in 2022 as the economy recovered.
From 2009, debt increased again due to the global financial crisis, reaching 51.41% in 2013. Poland managed to reduce debt levels to 42.53% by 2019. However, the pandemic pushed debt to 46.95% in 2020 before declining to 40.37% in 2022 as the economy recovered.
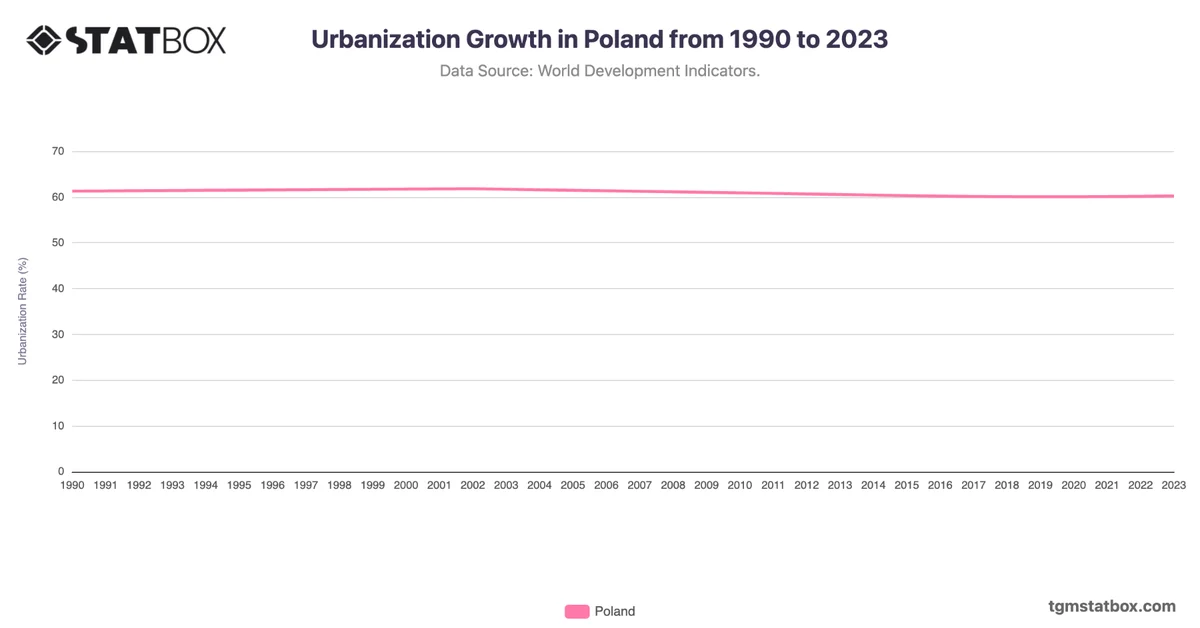
For additional information, visit statistics on Poland’s demographic count, Poland’s services sector share in GDP, Poland’s urbanization rate.