Poland’s unemployment rate experienced extreme highs and lows over the years, particularly in the early 2000s. After peaking at 19.9% in 2002 due to structural changes in the economy and the challenges of transitioning to a market-based economy, Poland gradually reduced unemployment. By 2008, the rate fell to 7.1% amid economic reforms and EU membership, which spurred job creation.
The pandemic in 2020 had a modest impact, with the rate slightly increasing to 3.2%, reflecting a stable response compared to earlier economic shocks. By 2023, the rate dropped to a low of 2.8%, showcasing Poland’s resilience and labor market adaptation within a modern EU framework.
The pandemic in 2020 had a modest impact, with the rate slightly increasing to 3.2%, reflecting a stable response compared to earlier economic shocks. By 2023, the rate dropped to a low of 2.8%, showcasing Poland’s resilience and labor market adaptation within a modern EU framework.
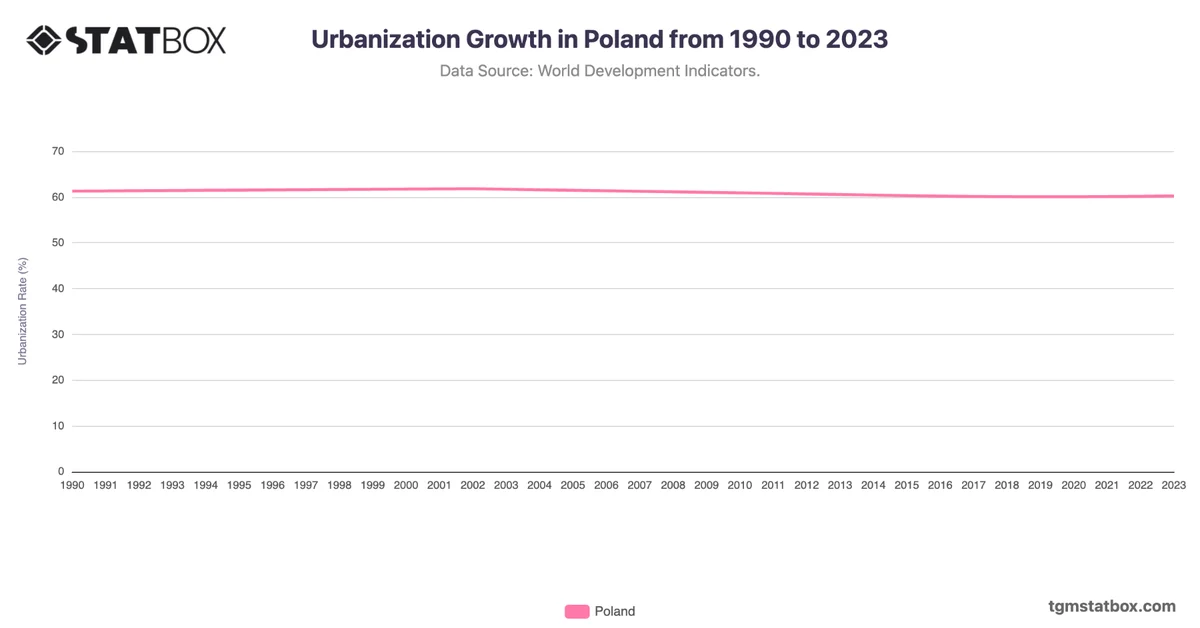
Find out more through related statistics on Poland’s demographic count, Poland’s annual GDP growth rate, Poland’s urbanization rate.