Poland's fertility rate dropped significantly from 2.1 in 1990 to 1.3 by the early 2000s, a trend linked to post-communist economic transitions. During this time, uncertainties around employment and shifting social policies likely led to delayed family planning.
While the rate slightly rebounded to 1.5 in the mid-2010s, efforts to sustain growth were insufficient to counteract long-term demographic challenges. Policies aimed at encouraging larger families have had limited success, with economic and cultural factors continuing to influence fertility decisions.
While the rate slightly rebounded to 1.5 in the mid-2010s, efforts to sustain growth were insufficient to counteract long-term demographic challenges. Policies aimed at encouraging larger families have had limited success, with economic and cultural factors continuing to influence fertility decisions.
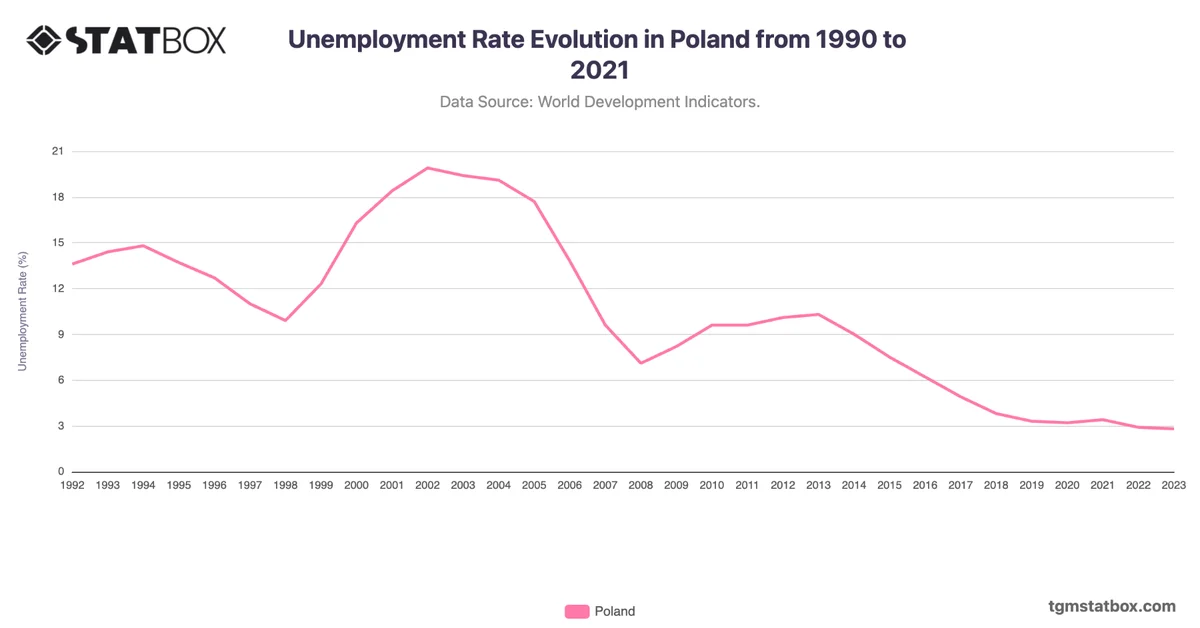
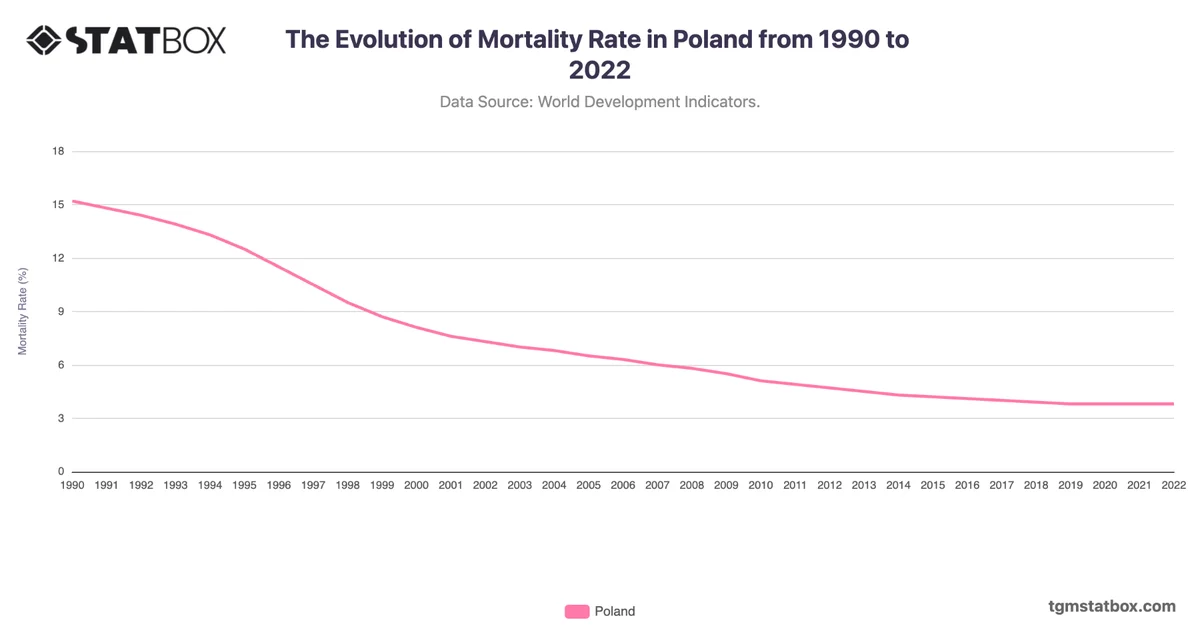
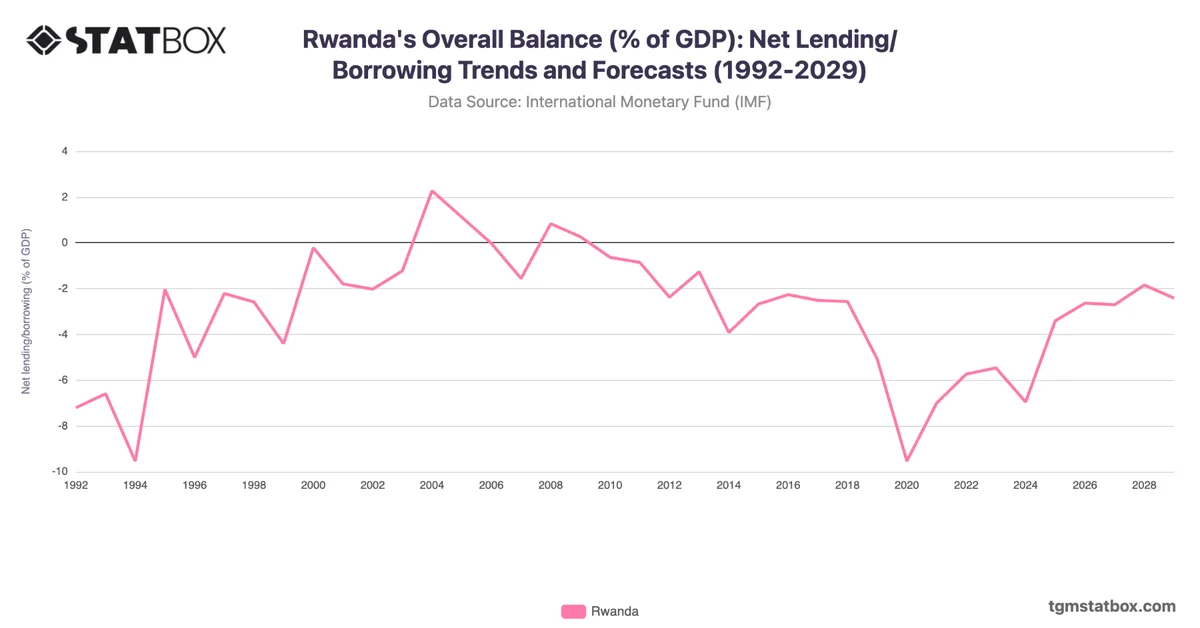
Explore related charts to gain a better understanding of Poland’s unemployment rate trends, Poland’s mortality rate trends, Poland’s net lending/borrowing as a percentage of its GDP.