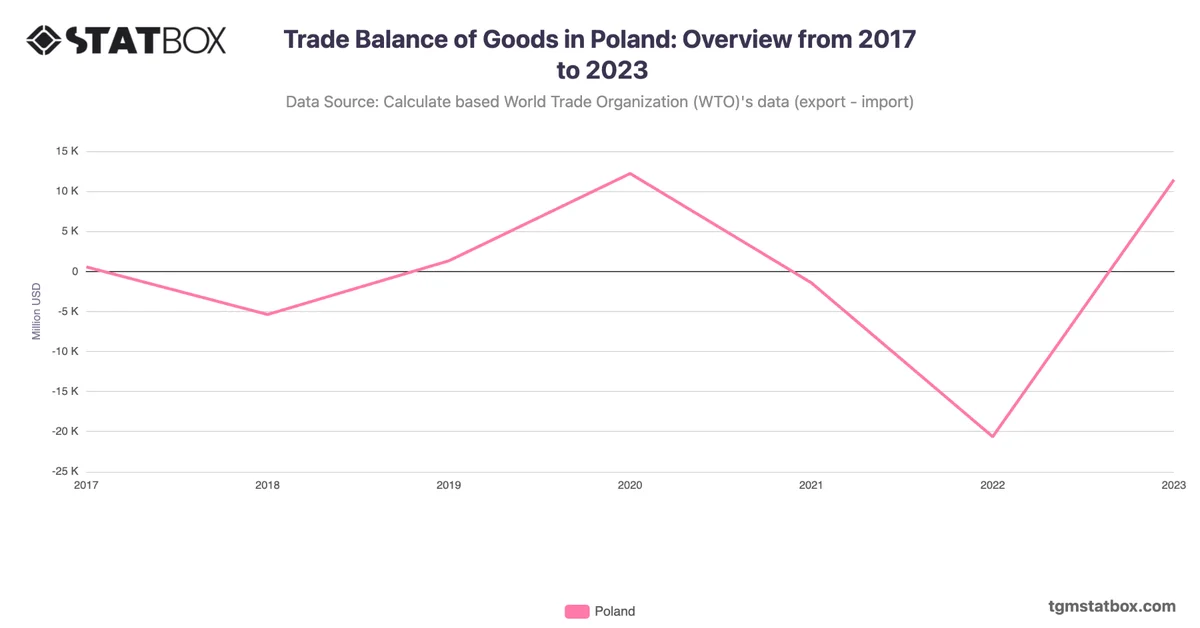
Poland’s import value grew from $11.6B in 1990 to $381.2B in 2022, showcasing its transformation into a key European economy. EU accession in 2004 catalyzed a surge in imports, rising from $89.6B to $208.8B by 2008, driven by trade integration and infrastructure development.
After a dip during the 2009 financial crisis, imports rebounded, peaking at $381.2B in 2022. By 2023, imports slightly declined to $370.1B, reflecting stabilization. Poland’s import growth reflects its industrial development and strong trade ties within the EU.
After a dip during the 2009 financial crisis, imports rebounded, peaking at $381.2B in 2022. By 2023, imports slightly declined to $370.1B, reflecting stabilization. Poland’s import growth reflects its industrial development and strong trade ties within the EU.
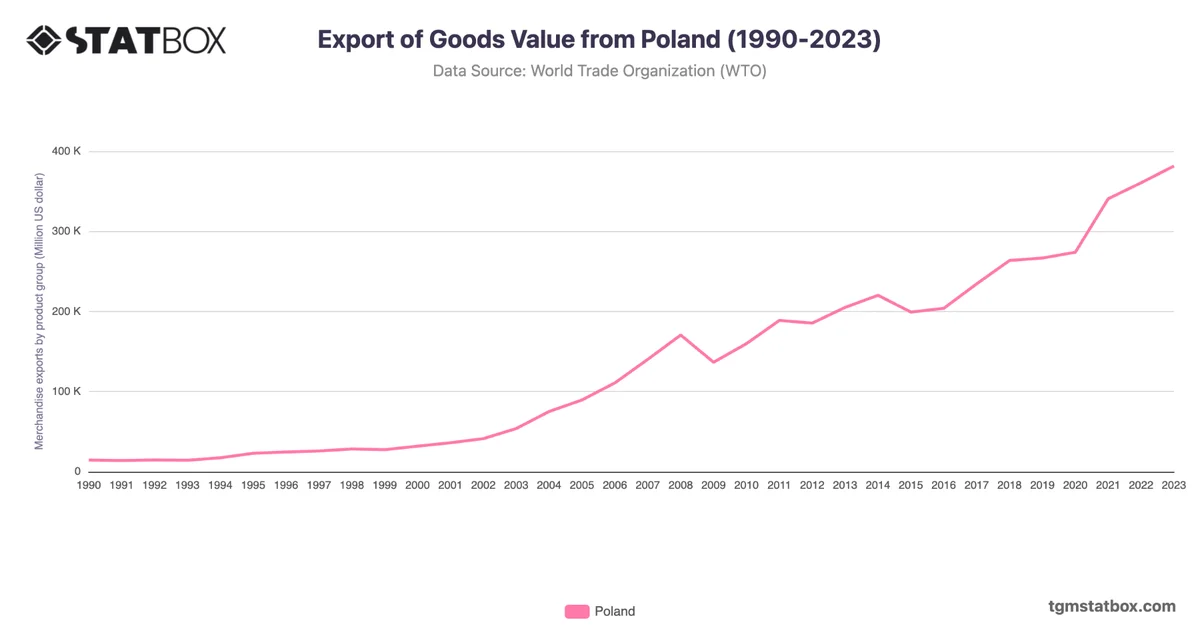
For additional information, visit statistics on Poland’s goods export value, Poland’s agriculture GDP share, Poland’s demographic count.