Share the statistic on social media channels or embed the statistic in your website using "Embed Code", where available.
Share chart
Embed chart Embed copied!Cite this statistic and select one of the following formats: APA, Chicago, Harvard, MLA & Bluebook
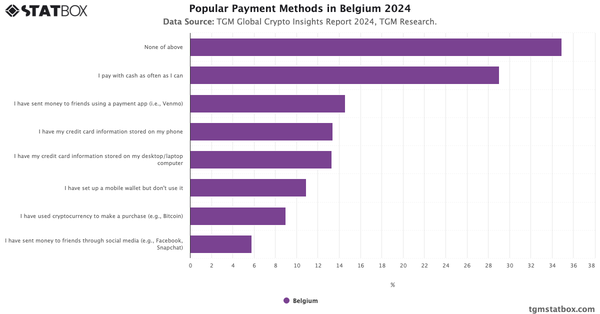
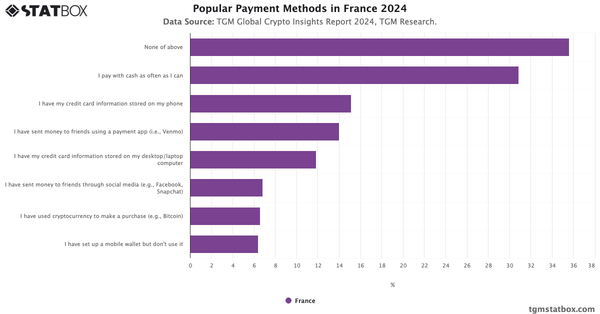
"Which of the following statements about paying for things are true for you?"
Key Takeaways
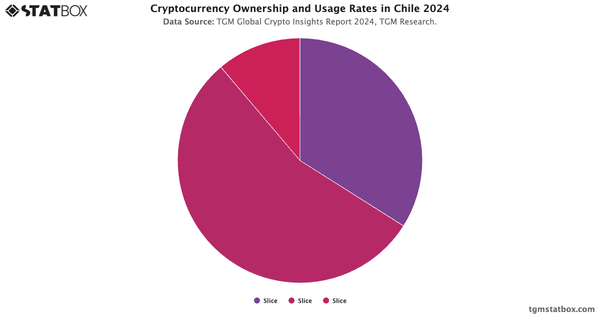
In Chile, cash remains a popular payment method, with about 35% of people saying they pay with cash whenever they can. Digital payments are also on the rise, around 27% store their credit card info on their phones, and roughly 19% keep it on their computers. Sending money through payment apps is fairly common too, while fewer use social media for transfers.
For more insights, discover related statistics on Preferred cryptocurrency storage methods in Chile, crypto awareness in Chile, Chileans’ crypto interest.

Cryptocurrency Insights Report in Chile
Find out about Cryptocurrency users in Chile with TGM StatBox. Access our detailed report, including graphs and tables, to uncover the market's trends.
Go to report


Connect with our expert team for immediate assistance or comprehensive market analysis. We are always ready to support your business needs.