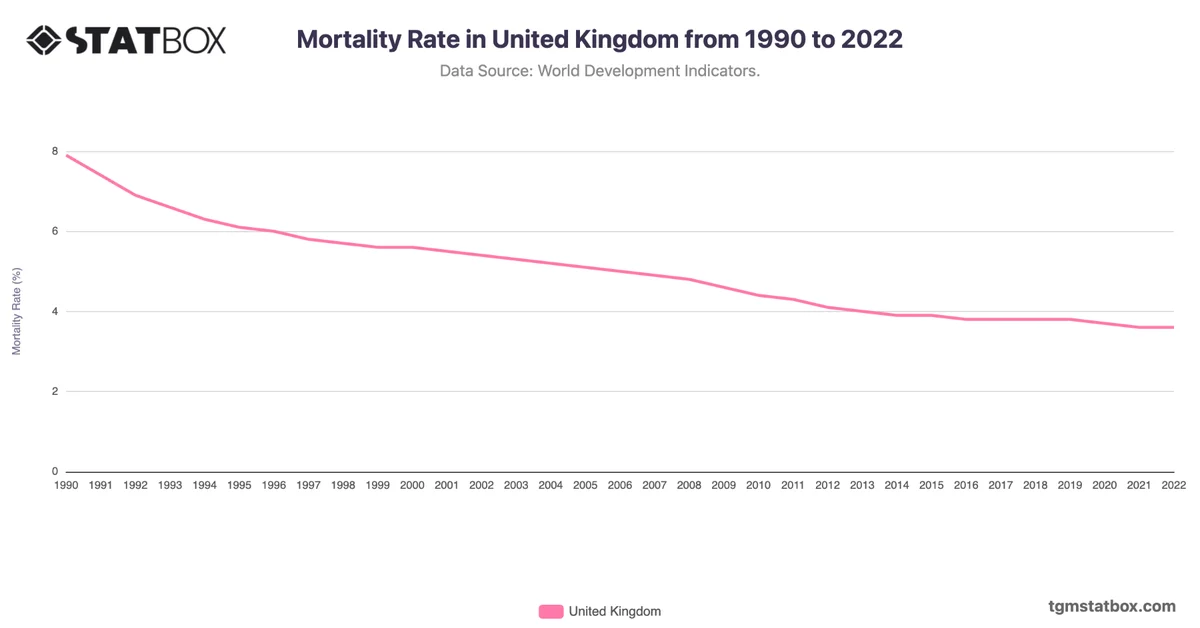
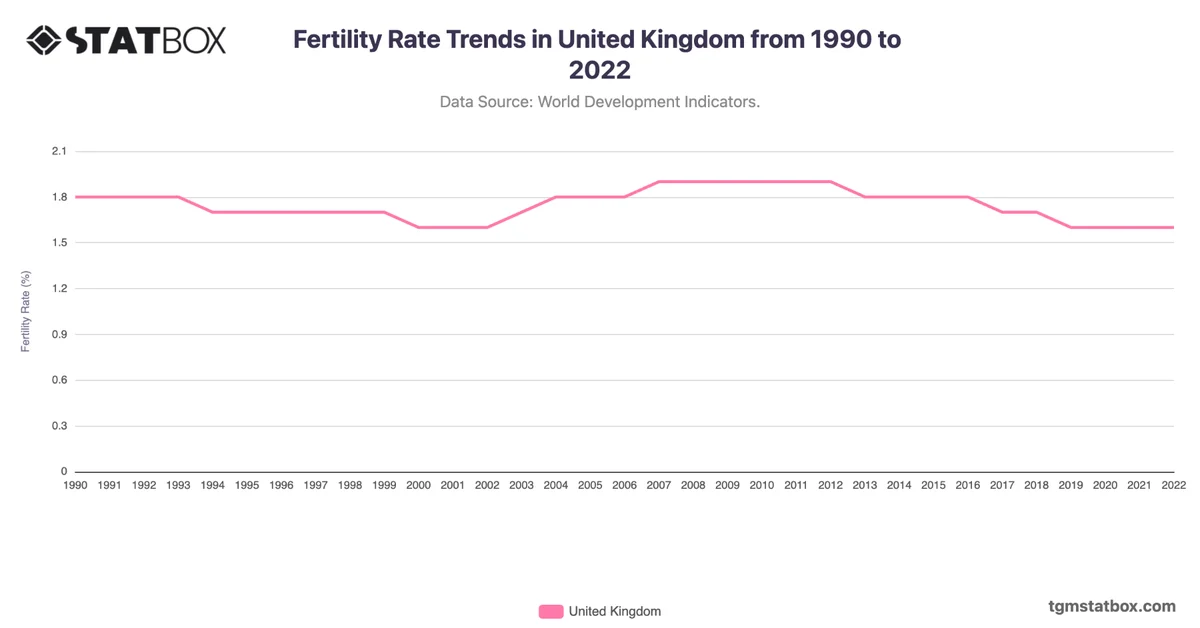
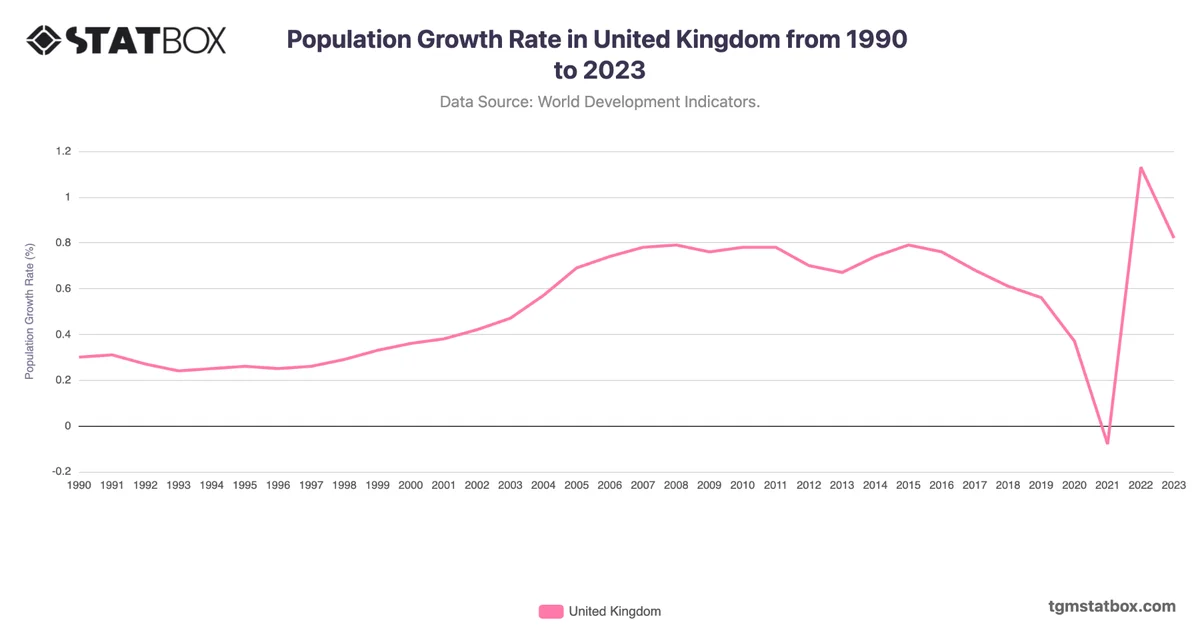
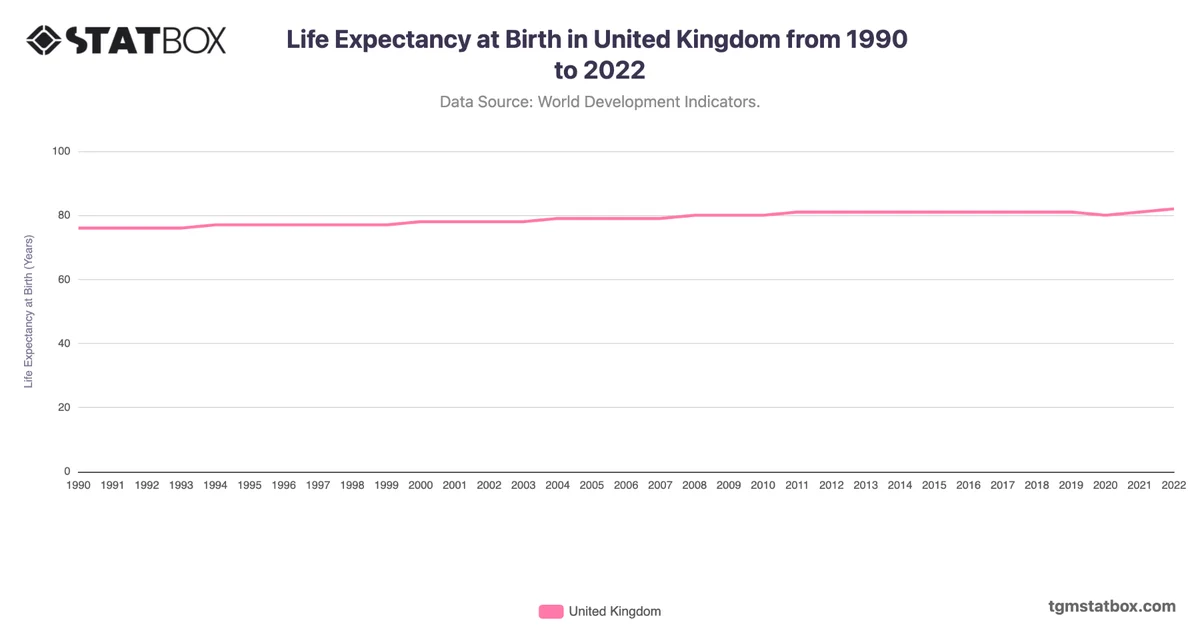
The death rate in the United Kingdom has generally declined over the past three decades, from 11.2 per 1,000 people in 1990 to 9.1 in 2022. Improvements in healthcare, particularly in treating chronic diseases and reducing mortality from infectious diseases, have been key drivers of this decline. However, there were fluctuations in the data, with notable increases in 2020 and 2021, primarily due to the COVID-19 pandemic, which caused the death rate to spike to 10.1.
As the UK’s population ages, the death rate remains higher than in many other European countries, reflecting the increasing prevalence of age-related illnesses. The healthcare system’s ongoing adaptation to these challenges, including the expansion of resources for elderly care and management of long-term conditions, will likely influence future trends in the death rate.
As the UK’s population ages, the death rate remains higher than in many other European countries, reflecting the increasing prevalence of age-related illnesses. The healthcare system’s ongoing adaptation to these challenges, including the expansion of resources for elderly care and management of long-term conditions, will likely influence future trends in the death rate.
Find out more through related statistics on United Kingdom’s annual GDP growth rate, United Kingdom’s population growth, United Kingdom’s agriculture share in GDP.