Gender Alignment in Omnichannel Christmas Shopping Preferences
How consumers distribute holiday gift purchases between physical stores and digital platforms has become a central consideration for retail planning. The choice between in-store and online channels involves trade-offs around convenience, product discovery, delivery reliability, and the tactile experience of shopping, making channel preference a meaningful dimension of seasonal retail behaviour.
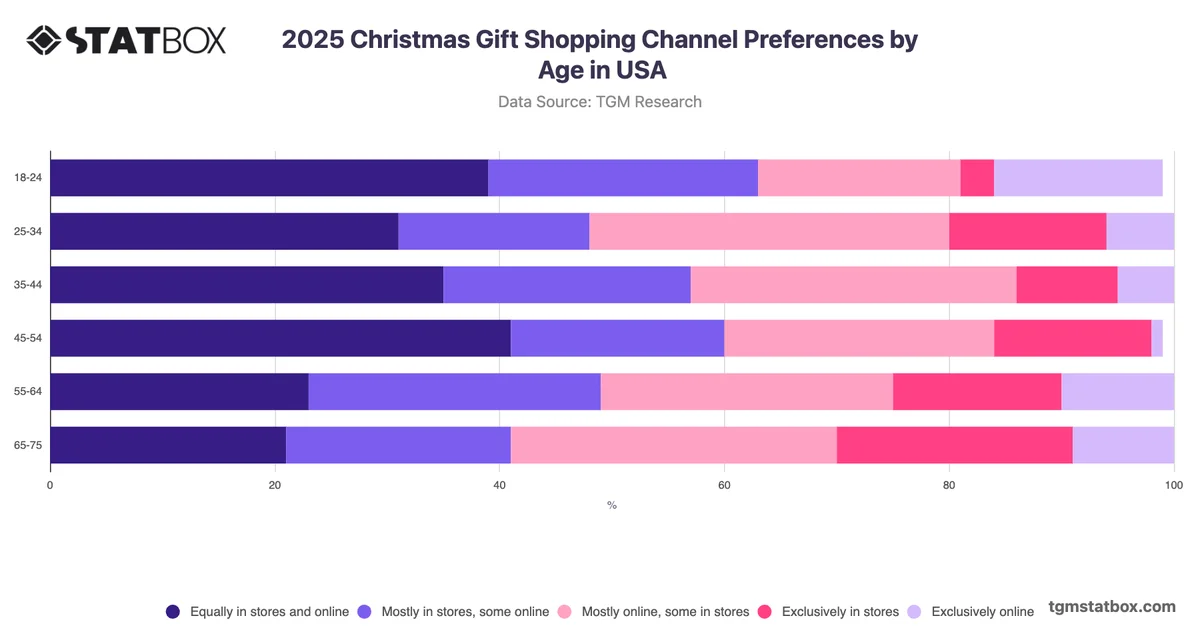
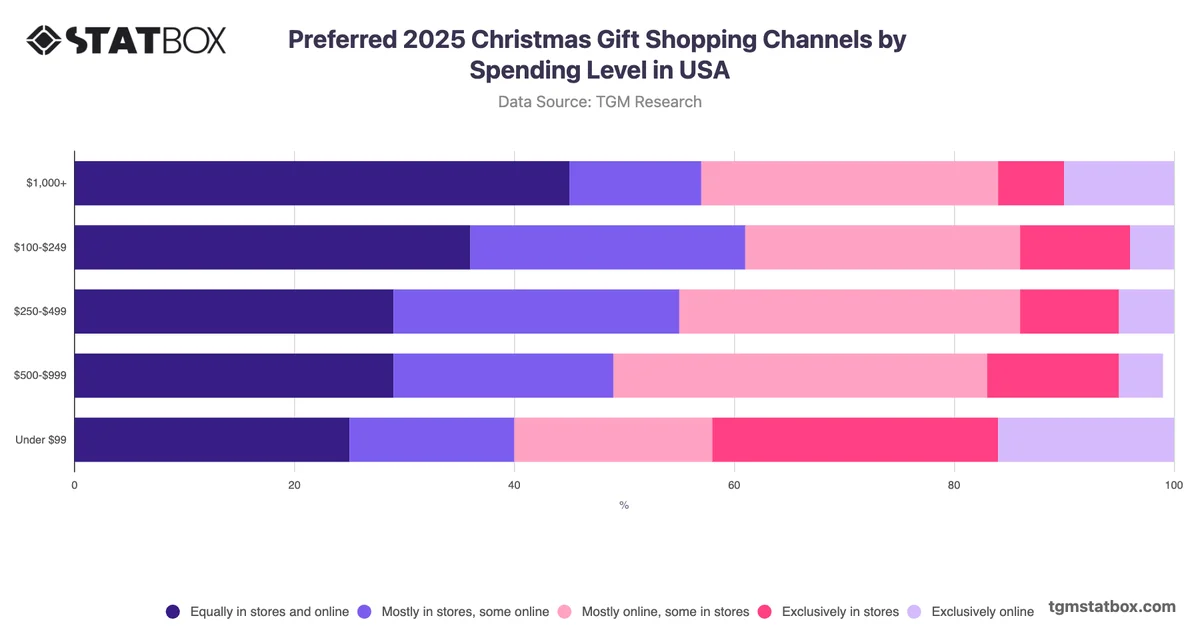
The most notable pattern in Christmas shopping channel preferences in the USA is not a clear divide between online and in-store shoppers, but rather a strong concentration around blended approaches, with gender playing a minimal role in differentiating behaviour. Across both male and female respondents, the combined omnichannel categories account for the substantial majority of intended shoppers, while exclusively digital or exclusively physical approaches attract comparatively limited support. Male respondents are marginally more inclined toward a primarily online approach at 28%, while females lean slightly more toward a primarily in-store orientation at 23%, yet these differences are modest rather than structural. The data suggests that the dominant consumer posture is one of deliberate channel mixing rather than strong commitment to either extreme. For retailers planning 2025 holiday campaigns, this points to the value of testing integrated messaging that supports cross-channel purchase journeys rather than segmenting communications by gender-based channel assumptions.