Agriculture Sector Contribution to GDP in South Africa (1990-2022)

Agriculture Sector Contribution to GDP in South Africa (1990-2022)

Share the statistic on social media channels or embed the statistic in your website using "Embed Code", where available.

Share chart

Embed chart
Select Citation

Cite this statistic and select one of the following formats: APA, Chicago, Harvard, MLA & Bluebook


  • APA
  • Chicago
  • Harvard
  • MLA
  • Bluebook
  • IEEE
TGM StatBox. (2024). Agriculture Sector Contribution to GDP in South Africa (1990-2022). TGM StatBox.
Chart Details
Timeframe: 1990-2022
Published date: 2024
Survey Question: Agriculture (% of GDP), according to World Development Indicators, measures the contribution of the agricultural sector to a country's Gross Domestic Product (GDP). This metric reflects the economic significance of activities such as farming, forestry, and fishing, indicating the value generated by agriculture relative to the overall economy.
Key Takeaways
South Africa’s agriculture sector has contributed modestly to GDP, declining from 3.8% in 1990 to around 2.8% in 2022. The sector’s reduced share reflects South Africa’s focus on mining, industry, and services. Periodic fluctuations, such as an increase to 3.0% in 2002, reflect the sector’s response to favorable commodity prices and demand.

The slight rise to 2.8% in recent years underscores agriculture’s stability in South Africa’s economy, with the sector essential for rural employment and food security despite a minimal GDP share.

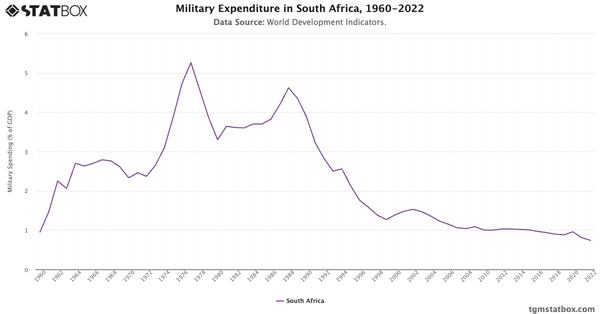
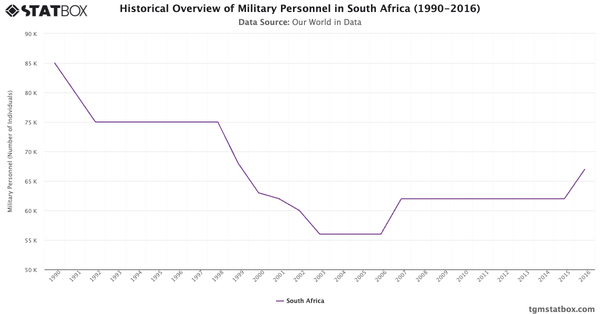
Explore related charts to gain a better understanding of military personnel share in South Africa’s population, South Africa’s annual foreign aid data, South Africa’s working-age population share.

Would you like to know more?
Check our report on this topic

Sustainability Report: Insights in South Africa

South Africa Sustainability Insights Report 2024

Sustainability Report: Insights in South Africa

Explore the latest South Africa insights on sustainability with TGM’s 2024 report series. Access data on behaviors, challenges, and motivations across 30+ markets.

Go to report

Further Recommended Statistics

Statbox vector
Statbox |form contact icon

Have Other Queries?

Statbox vector

Connect with our expert team for immediate assistance or comprehensive market analysis. We are always ready to support your business needs.