South Africa's fiscal balance has experienced significant fluctuations, reflecting both domestic economic challenges and external shocks. The early 2000s marked an improvement, with deficits narrowing from -1.38% in 2000 to a surplus of 1.22% in 2007. This was driven by strong economic growth, improved tax revenues, and sound fiscal management during a commodities boom.
However, the 2008 global financial crisis led to a sharp reversal, with the deficit widening to -4.67% in 2009. Persistent structural issues, including rising public debt, weak economic growth, and underperforming state-owned enterprises, have kept deficits elevated since then. The COVID-19 pandemic exacerbated these challenges, with the deficit peaking at -9.61% in 2020 due to emergency spending and reduced revenues.
Although recovery efforts have improved the fiscal position, forecasts indicate sustained deficits, stabilizing around -5.79% by 2029. Addressing long-term fiscal imbalances will require structural reforms to boost economic growth, enhance revenue collection, and curb inefficient expenditures.
However, the 2008 global financial crisis led to a sharp reversal, with the deficit widening to -4.67% in 2009. Persistent structural issues, including rising public debt, weak economic growth, and underperforming state-owned enterprises, have kept deficits elevated since then. The COVID-19 pandemic exacerbated these challenges, with the deficit peaking at -9.61% in 2020 due to emergency spending and reduced revenues.
Although recovery efforts have improved the fiscal position, forecasts indicate sustained deficits, stabilizing around -5.79% by 2029. Addressing long-term fiscal imbalances will require structural reforms to boost economic growth, enhance revenue collection, and curb inefficient expenditures.
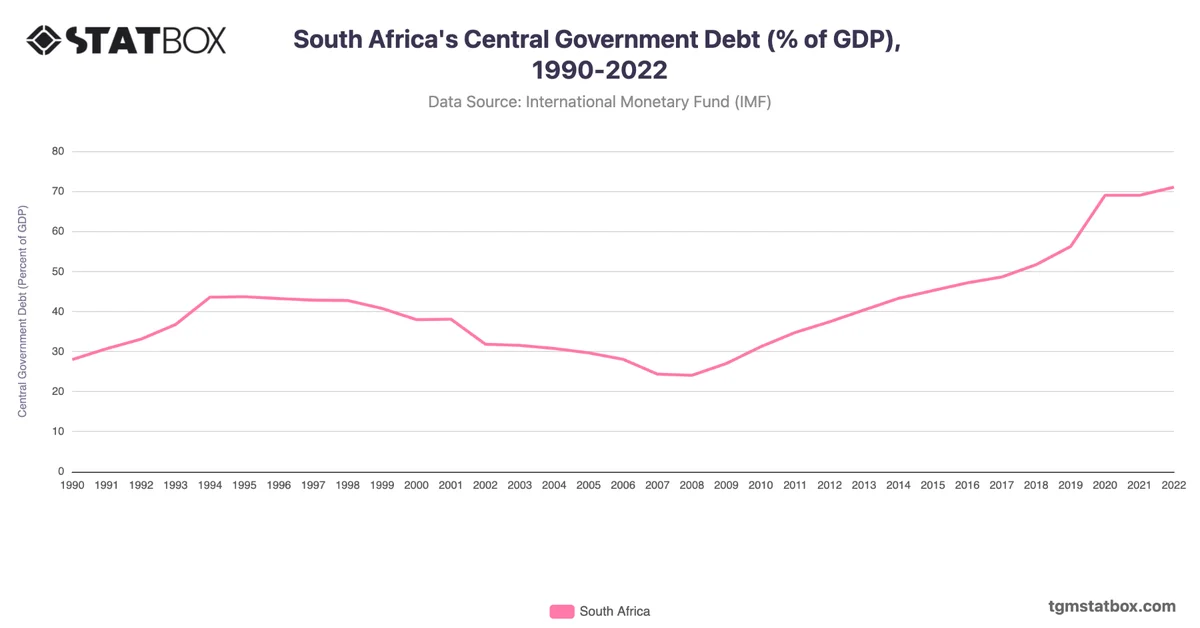
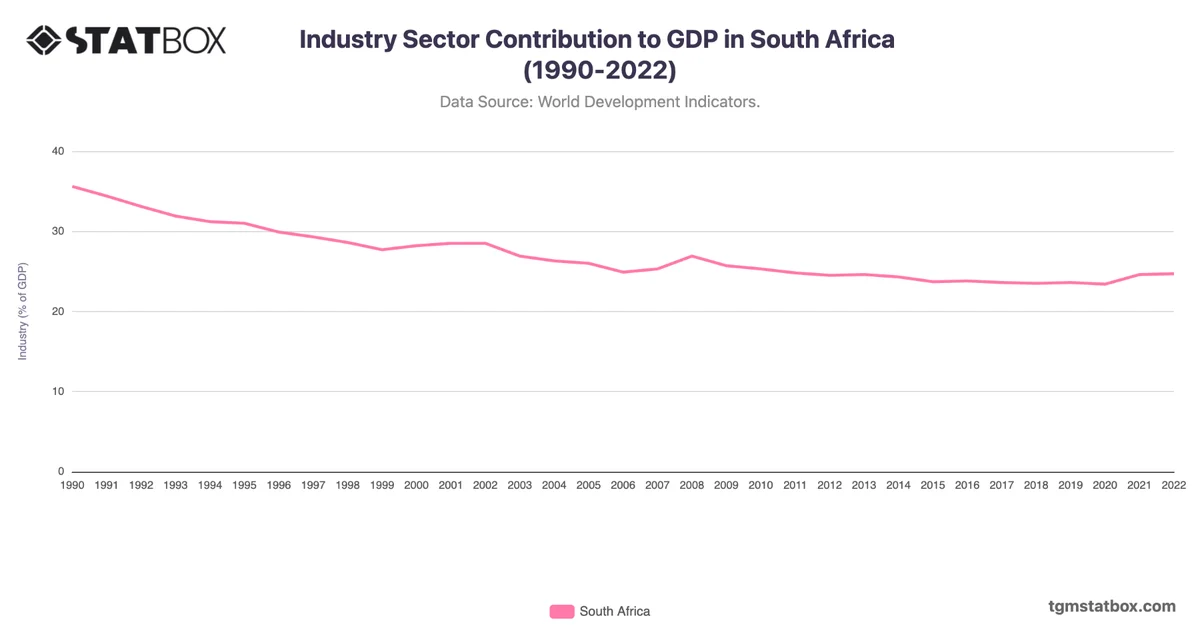
Find out more through related statistics on South Africa’s central government debt percentage, South Africa’s annual foreign aid data, South Africa’s manufacturing share in GDP.