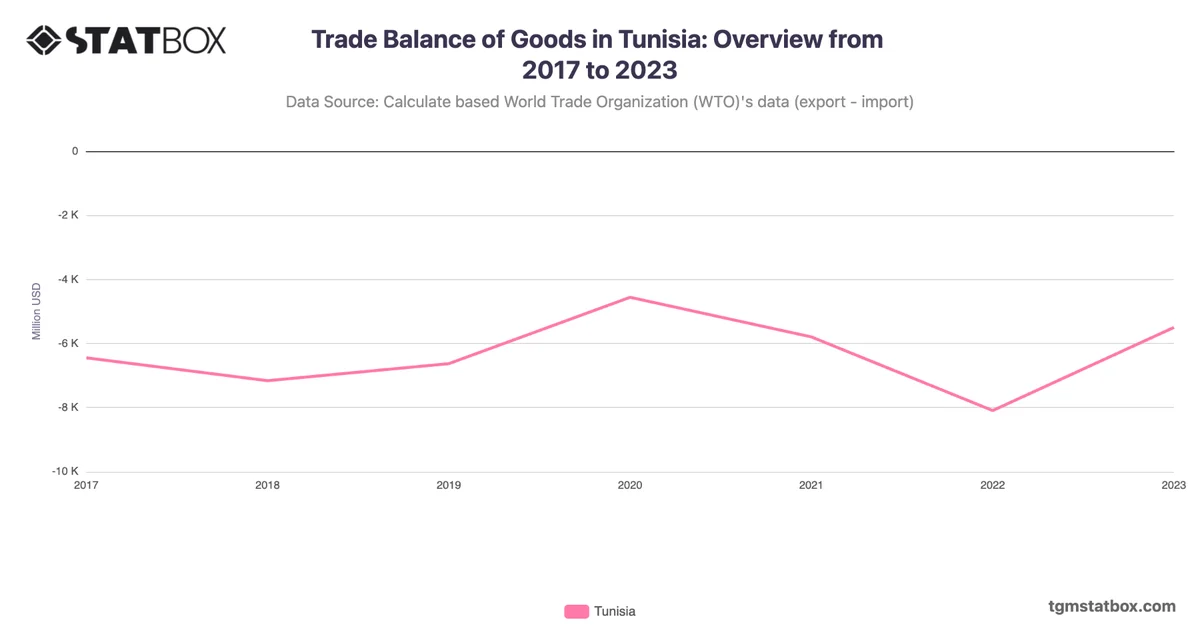
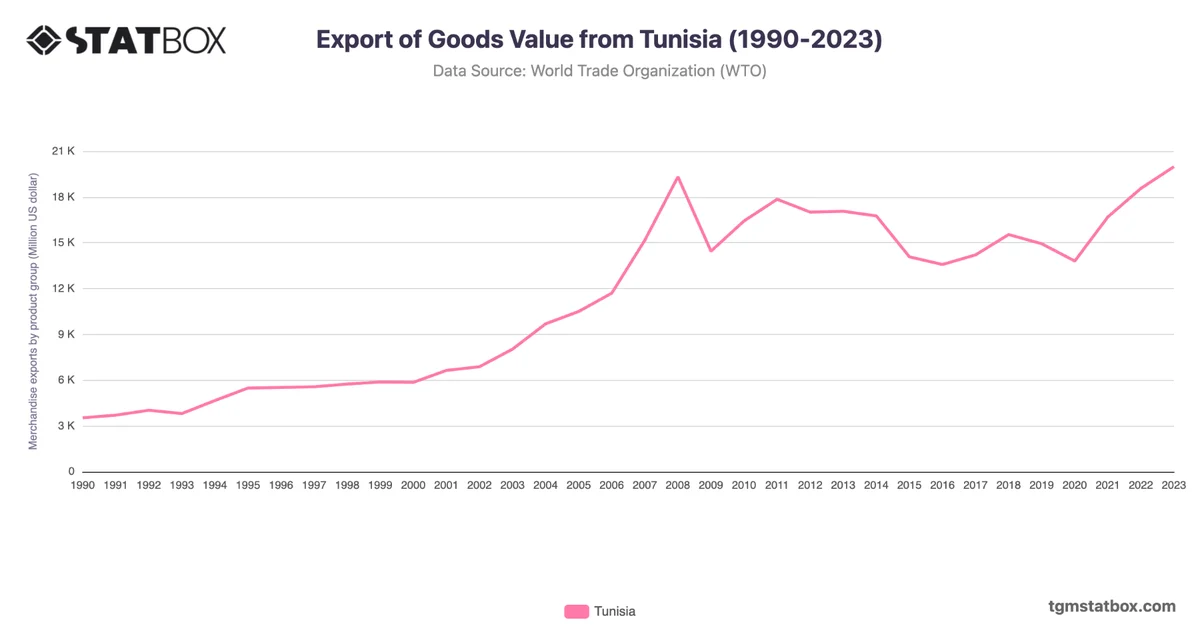
Tunisia’s imports steadily increased from $5.5B in 1990 to $26.6B in 2022, highlighting its economic development and trade liberalization. Growth accelerated in the 2000s, with imports rising from $10.9B in 2003 to $24.6B in 2008, fueled by industrial and consumer goods demand.
The 2022 peak reflects rising global prices and demand for energy and machinery. A slight decline to $25.5B in 2023 indicates economic stabilization. Tunisia’s import trends emphasize its growing industrial base and reliance on foreign goods for economic growth.
The 2022 peak reflects rising global prices and demand for energy and machinery. A slight decline to $25.5B in 2023 indicates economic stabilization. Tunisia’s import trends emphasize its growing industrial base and reliance on foreign goods for economic growth.
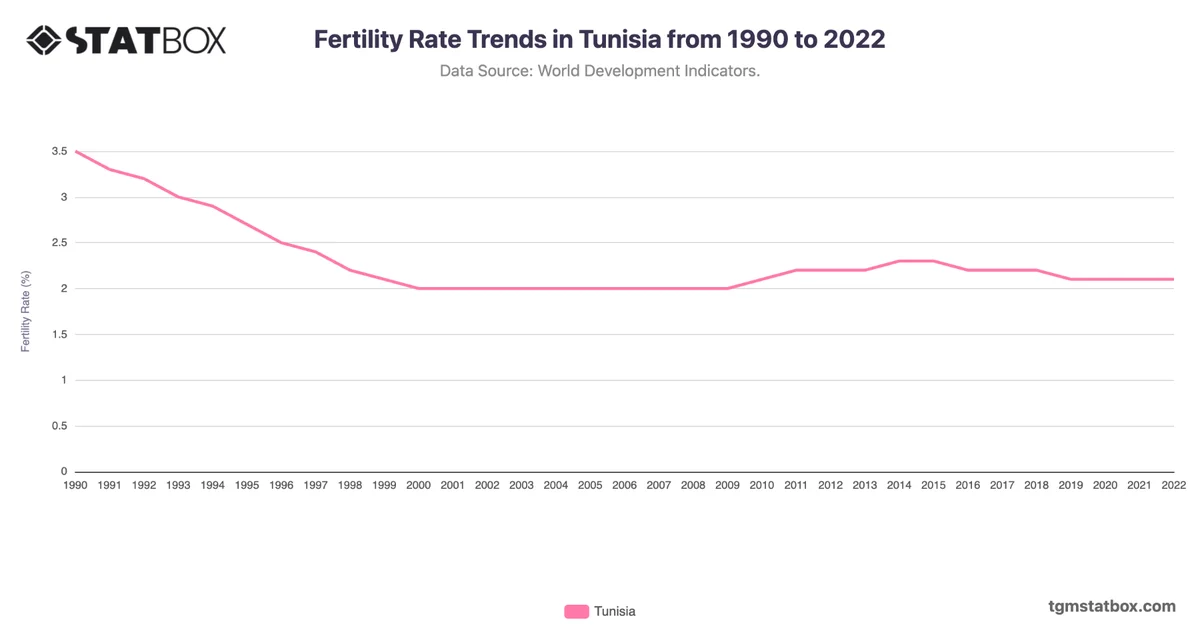
For additional information, visit statistics on Tunisia’s fertility rate pattern, Tunisia’s population total, Tunisia’s manufacturing sector share in GDP.