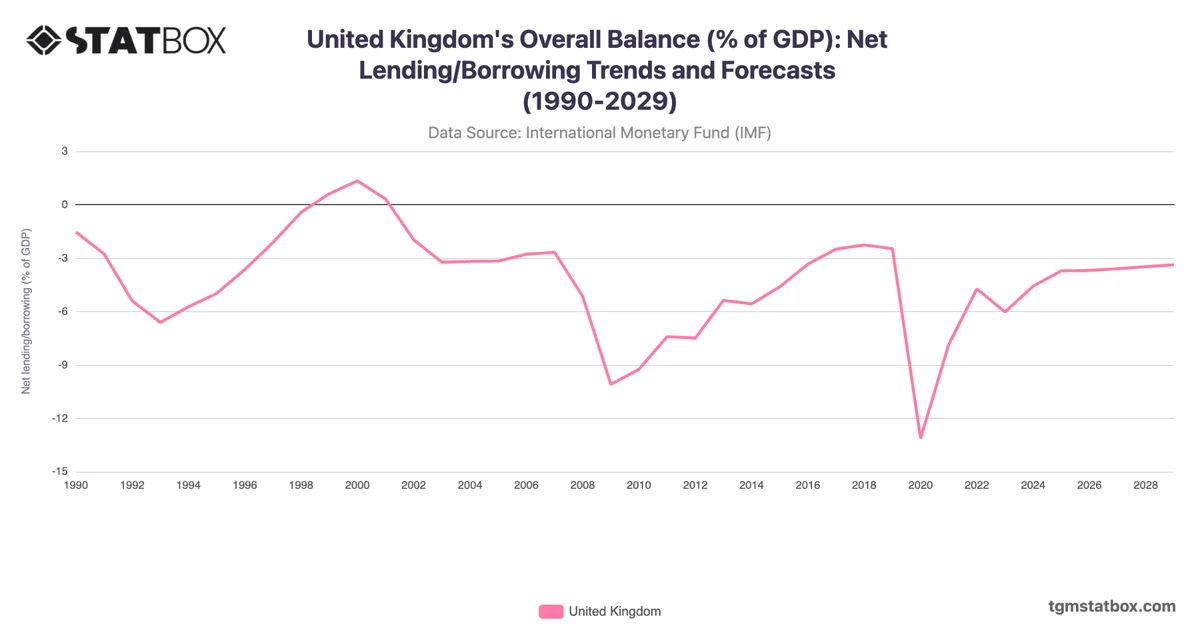
The UK’s central government debt steadily increased during the 1990s, reaching 42.56% by 1996 due to slower economic growth and fiscal expansion. The 2008 financial crisis marked a dramatic increase in debt levels, with debt soaring from 49.91% in 2008 to 86.14% by 2014, driven by stimulus spending and slow recovery.
The COVID-19 pandemic further exacerbated the situation, pushing debt to a peak of 105.1% in 2021. Although it eased slightly to 100.75% by 2022, the UK continues to face fiscal challenges as it balances post-pandemic recovery with economic stability.
The COVID-19 pandemic further exacerbated the situation, pushing debt to a peak of 105.1% in 2021. Although it eased slightly to 100.75% by 2022, the UK continues to face fiscal challenges as it balances post-pandemic recovery with economic stability.
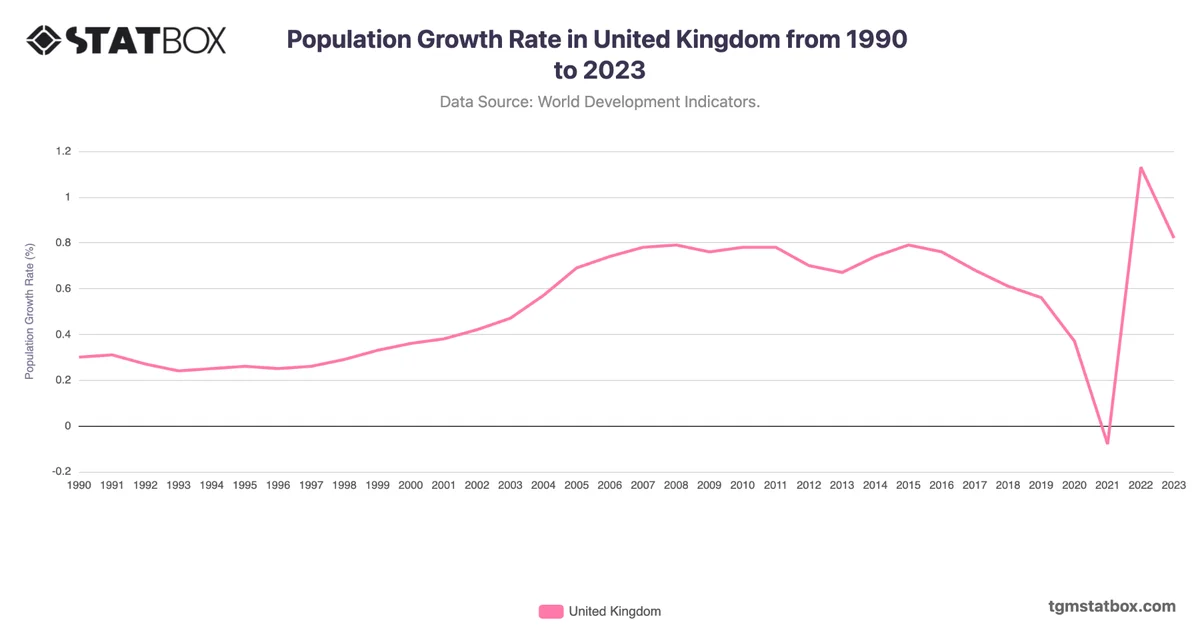
For a broader context, visit other statistics on United Kingdom’s population growth, United Kingdom's unemployment rate changes, United Kingdom’s export value.