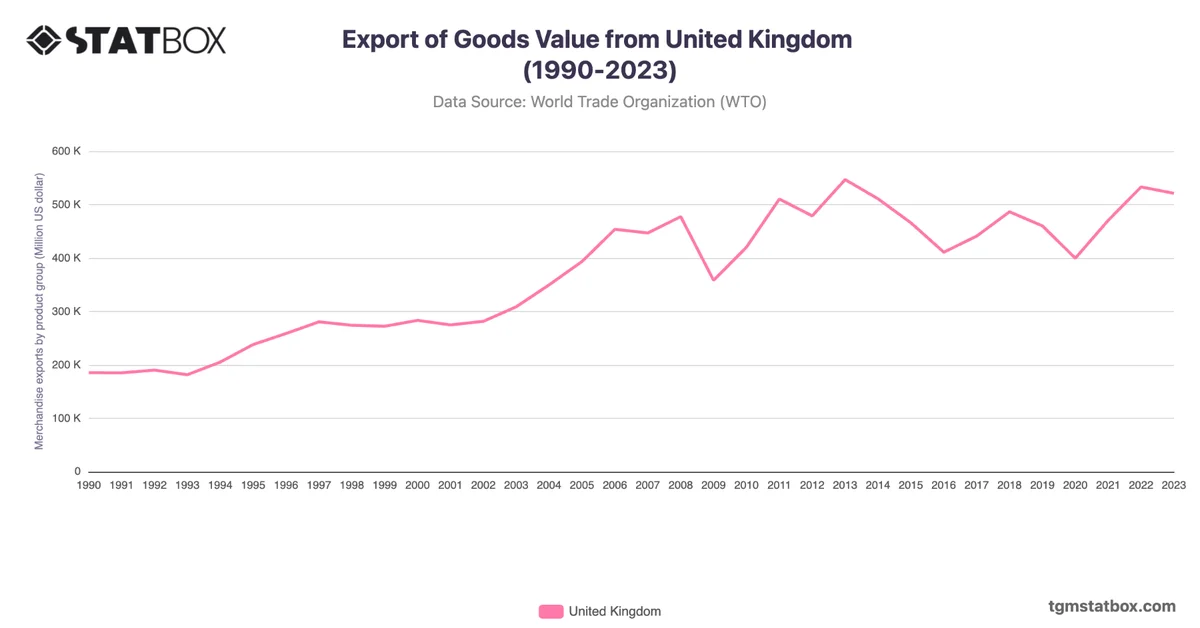
The UK’s import value expanded from $222.9B in 1990 to $823.5B in 2022, underscoring its role as a major global trade player. A significant rise occurred in the 2000s, with imports increasing from $394.6B in 2003 to $668.6B in 2008, driven by strong consumer demand and industrial growth.
The 2008 financial crisis caused a contraction, but imports rebounded, reaching $823.5B in 2022 due to higher energy costs and trade volume. A slight decrease to $791.5B in 2023 reflects stabilization in trade dynamics. The UK’s import trends highlight its interconnectedness with global supply chains.
The 2008 financial crisis caused a contraction, but imports rebounded, reaching $823.5B in 2022 due to higher energy costs and trade volume. A slight decrease to $791.5B in 2023 reflects stabilization in trade dynamics. The UK’s import trends highlight its interconnectedness with global supply chains.
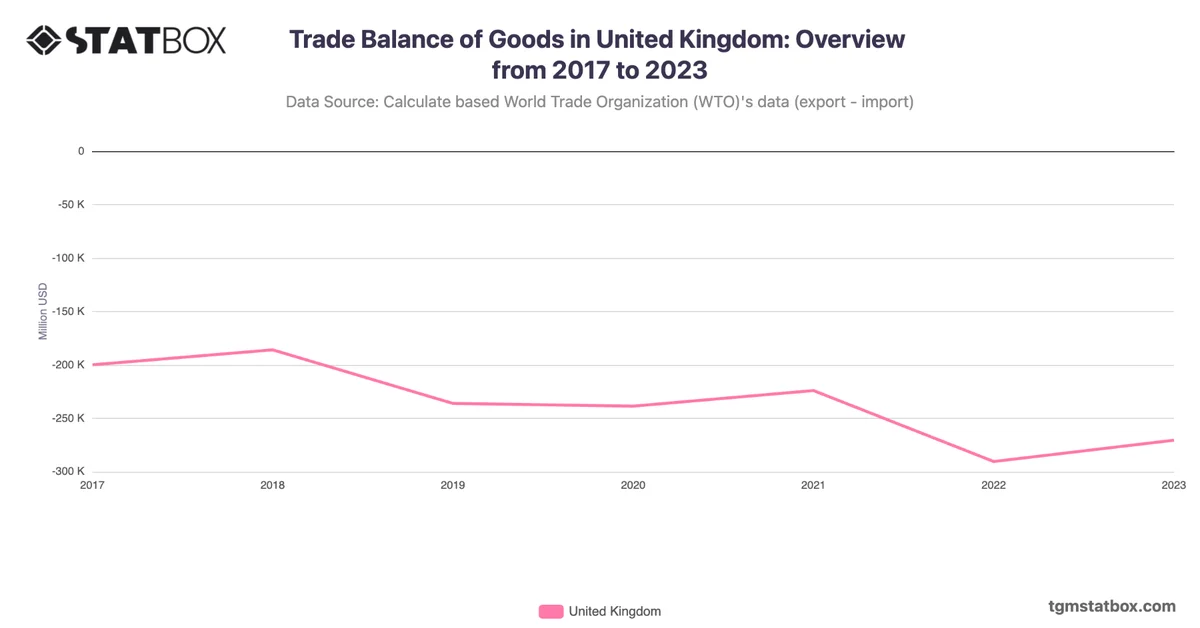
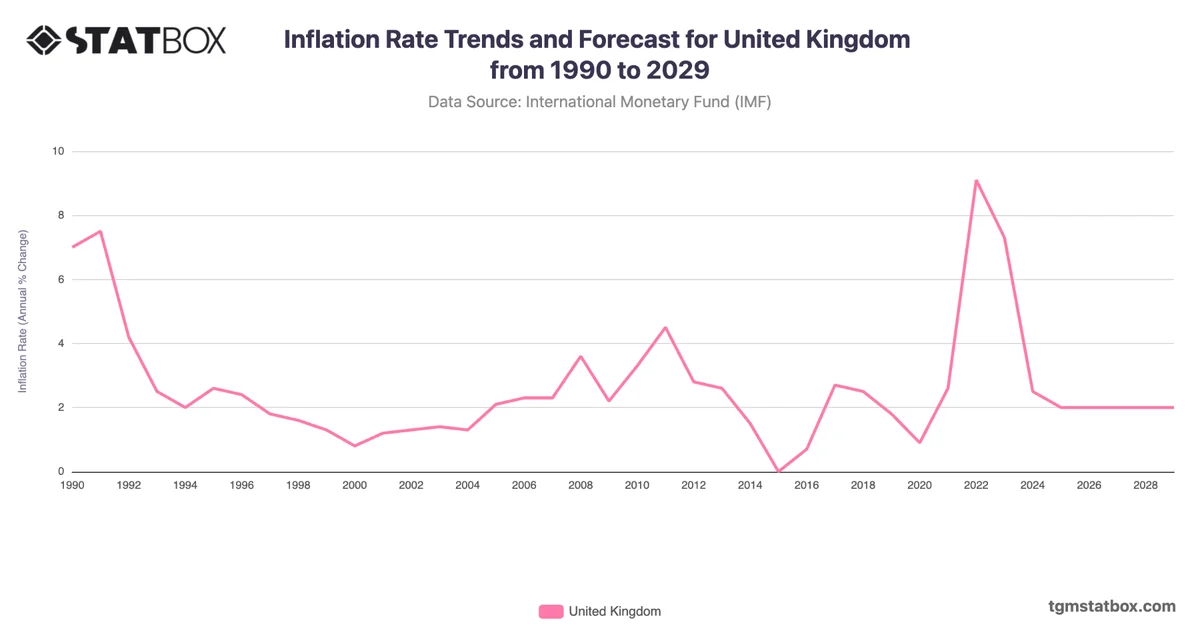
For a deeper dive into the topic, explore United Kingdom’s goods trade balance, Industry sector’s share in UK’s GDP, United Kingdom inflation rate forecast.